OPEN-SOURCE SCRIPT
Multi-Timeframe Moving Averages by Skyito
"Hope everyone likes this and finds it useful! This multi-timeframe moving average indicator provides a comprehensive view of moving averages from various timeframes directly on one chart. It’s designed to help traders analyze market trends and levels more effectively without constantly switching between charts.
Script Explanation: This indicator supports a range of moving average types, including SMA, EMA, HMA, WMA, VWMA, RMA, SSMA, and DEMA, allowing for flexibility in analysis. Each moving average is fully customizable by length and type for each timeframe, giving you control over how trends are represented.
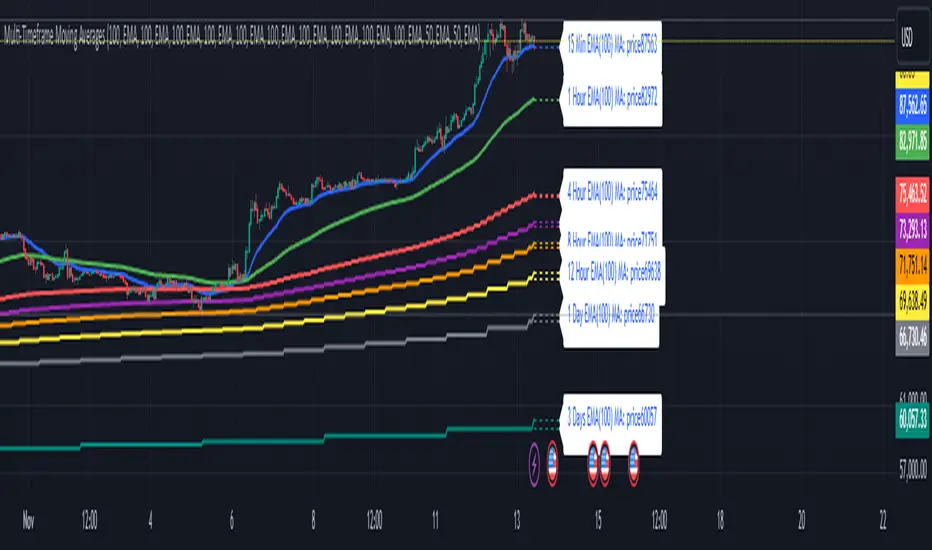
The indicator includes timeframes such as 15 minutes, 1 hour, 4 hours, 6 hours, 8 hours, 12 hours, 1 day, 3 days, 5 days, 1 week, 3 weeks, and 1 month. Each moving average is displayed as a line with a small dashed extension, showing a label that contains the moving average’s timeframe, type, and current price level. The dark blue labels are slightly enlarged to enhance readability on the chart, making it easier to track important levels at a glance.
Use Case: This tool is ideal for traders looking to stay aware of trend levels across multiple timeframes on one chart. Adjusting the moving averages’ lengths and types enables customization for any strategy, while the label information provides an immediate understanding of the timeframe and trend context.
Enjoy the streamlined view and the added insights from multi-timeframe analysis!"
Script Explanation: This indicator supports a range of moving average types, including SMA, EMA, HMA, WMA, VWMA, RMA, SSMA, and DEMA, allowing for flexibility in analysis. Each moving average is fully customizable by length and type for each timeframe, giving you control over how trends are represented.
The indicator includes timeframes such as 15 minutes, 1 hour, 4 hours, 6 hours, 8 hours, 12 hours, 1 day, 3 days, 5 days, 1 week, 3 weeks, and 1 month. Each moving average is displayed as a line with a small dashed extension, showing a label that contains the moving average’s timeframe, type, and current price level. The dark blue labels are slightly enlarged to enhance readability on the chart, making it easier to track important levels at a glance.
Use Case: This tool is ideal for traders looking to stay aware of trend levels across multiple timeframes on one chart. Adjusting the moving averages’ lengths and types enables customization for any strategy, while the label information provides an immediate understanding of the timeframe and trend context.
Enjoy the streamlined view and the added insights from multi-timeframe analysis!"
오픈 소스 스크립트
트레이딩뷰의 진정한 정신에 따라, 이 스크립트의 작성자는 이를 오픈소스로 공개하여 트레이더들이 기능을 검토하고 검증할 수 있도록 했습니다. 작성자에게 찬사를 보냅니다! 이 코드는 무료로 사용할 수 있지만, 코드를 재게시하는 경우 하우스 룰이 적용된다는 점을 기억하세요.
면책사항
해당 정보와 게시물은 금융, 투자, 트레이딩 또는 기타 유형의 조언이나 권장 사항으로 간주되지 않으며, 트레이딩뷰에서 제공하거나 보증하는 것이 아닙니다. 자세한 내용은 이용 약관을 참조하세요.
오픈 소스 스크립트
트레이딩뷰의 진정한 정신에 따라, 이 스크립트의 작성자는 이를 오픈소스로 공개하여 트레이더들이 기능을 검토하고 검증할 수 있도록 했습니다. 작성자에게 찬사를 보냅니다! 이 코드는 무료로 사용할 수 있지만, 코드를 재게시하는 경우 하우스 룰이 적용된다는 점을 기억하세요.
면책사항
해당 정보와 게시물은 금융, 투자, 트레이딩 또는 기타 유형의 조언이나 권장 사항으로 간주되지 않으며, 트레이딩뷰에서 제공하거나 보증하는 것이 아닙니다. 자세한 내용은 이용 약관을 참조하세요.