OPEN-SOURCE SCRIPT
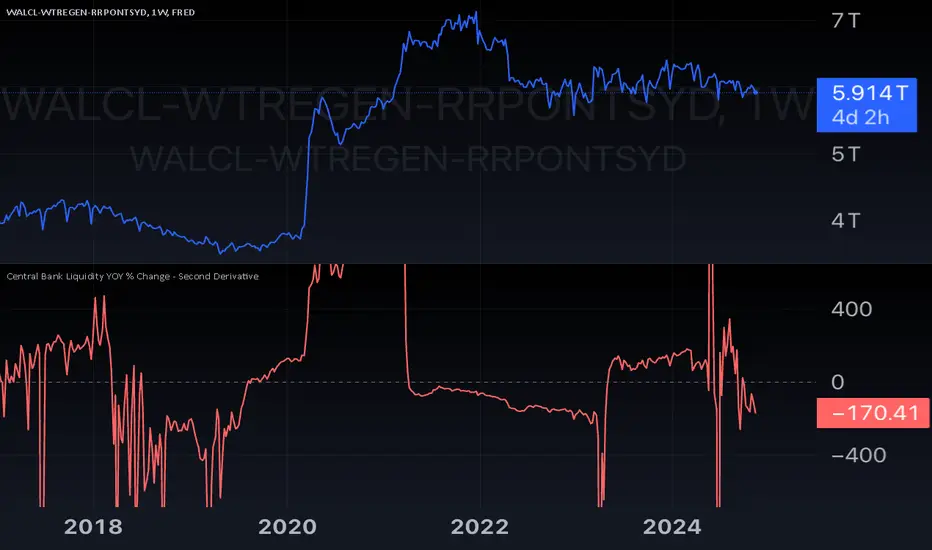
Central Bank Liquidity YOY % Change - Second Derivative

This indicator measures the acceleration or deceleration in the yearly growth rate of central bank liquidity.
By calculating the year-over-year percentage change of the YoY growth rate, it highlights shifts in the pace of liquidity changes, providing insights into market momentum or potential reversals influenced by central bank actions.
This can help reveal impulses in liquidity by identifying changes in the growth rate's acceleration or deceleration. When central bank liquidity experiences a rapid increase or decrease, the second derivative captures these shifts as sharp upward or downward movements.
These impulses often signal pivotal liquidity shifts, which may correspond to major policy changes, market interventions, or financial stability measures, offering an early signal of potential market impacts.
오픈 소스 스크립트
트레이딩뷰의 진정한 정신에 따라, 이 스크립트의 작성자는 이를 오픈소스로 공개하여 트레이더들이 기능을 검토하고 검증할 수 있도록 했습니다. 작성자에게 찬사를 보냅니다! 이 코드는 무료로 사용할 수 있지만, 코드를 재게시하는 경우 하우스 룰이 적용된다는 점을 기억하세요.
면책사항
해당 정보와 게시물은 금융, 투자, 트레이딩 또는 기타 유형의 조언이나 권장 사항으로 간주되지 않으며, 트레이딩뷰에서 제공하거나 보증하는 것이 아닙니다. 자세한 내용은 이용 약관을 참조하세요.
오픈 소스 스크립트
트레이딩뷰의 진정한 정신에 따라, 이 스크립트의 작성자는 이를 오픈소스로 공개하여 트레이더들이 기능을 검토하고 검증할 수 있도록 했습니다. 작성자에게 찬사를 보냅니다! 이 코드는 무료로 사용할 수 있지만, 코드를 재게시하는 경우 하우스 룰이 적용된다는 점을 기억하세요.
면책사항
해당 정보와 게시물은 금융, 투자, 트레이딩 또는 기타 유형의 조언이나 권장 사항으로 간주되지 않으며, 트레이딩뷰에서 제공하거나 보증하는 것이 아닙니다. 자세한 내용은 이용 약관을 참조하세요.