OPEN-SOURCE SCRIPT
RSI Dashboard Multi-TF
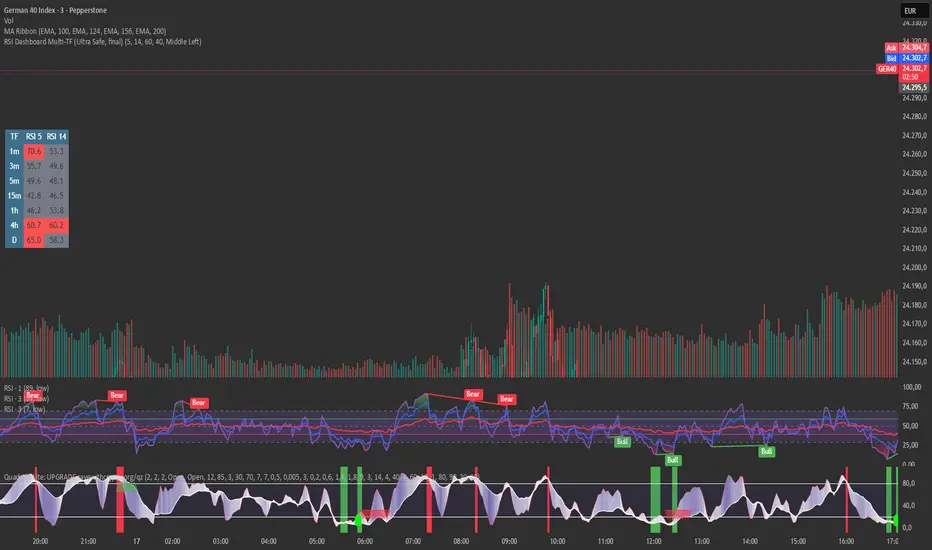
This script displays RSI values from multiple timeframes in a compact dashboard directly on the chart.
It is designed for traders who want to quickly identify whether the market is overbought, oversold, or neutral across different timeframes, without constantly switching chart intervals.
The dashboard shows the RSI simultaneously for the following timeframes:
- 1 minute
- 3 minutes
- 5 minutes
- 15 minutes
- 1 hour
- 4 hours
- Daily
Typical use cases:
- Scalping & intraday trading
- Multi-timeframe analysis at a glance
- Entry confirmation (e.g. pullbacks, breakouts)
- Avoiding trades against overbought or oversold market conditions
- Complementing EMA, VWAP, or price action strategies
⚙️ Notes
This dashboard is an analysis tool, not an automated trading system.
No repainting (uses request.security).
Suitable for indices, forex, crypto, and commodities.
This RSI dashboard provides a fast, clear, and visually clean market overview across multiple timeframes, making it an ideal tool for active traders who want to make efficient and well-structured trading decisions.
오픈 소스 스크립트
트레이딩뷰의 진정한 정신에 따라, 이 스크립트의 작성자는 이를 오픈소스로 공개하여 트레이더들이 기능을 검토하고 검증할 수 있도록 했습니다. 작성자에게 찬사를 보냅니다! 이 코드는 무료로 사용할 수 있지만, 코드를 재게시하는 경우 하우스 룰이 적용된다는 점을 기억하세요.
면책사항
해당 정보와 게시물은 금융, 투자, 트레이딩 또는 기타 유형의 조언이나 권장 사항으로 간주되지 않으며, 트레이딩뷰에서 제공하거나 보증하는 것이 아닙니다. 자세한 내용은 이용 약관을 참조하세요.
오픈 소스 스크립트
트레이딩뷰의 진정한 정신에 따라, 이 스크립트의 작성자는 이를 오픈소스로 공개하여 트레이더들이 기능을 검토하고 검증할 수 있도록 했습니다. 작성자에게 찬사를 보냅니다! 이 코드는 무료로 사용할 수 있지만, 코드를 재게시하는 경우 하우스 룰이 적용된다는 점을 기억하세요.
면책사항
해당 정보와 게시물은 금융, 투자, 트레이딩 또는 기타 유형의 조언이나 권장 사항으로 간주되지 않으며, 트레이딩뷰에서 제공하거나 보증하는 것이 아닙니다. 자세한 내용은 이용 약관을 참조하세요.