OPEN-SOURCE SCRIPT
BIST30 % Above Moving Average (Breadth)
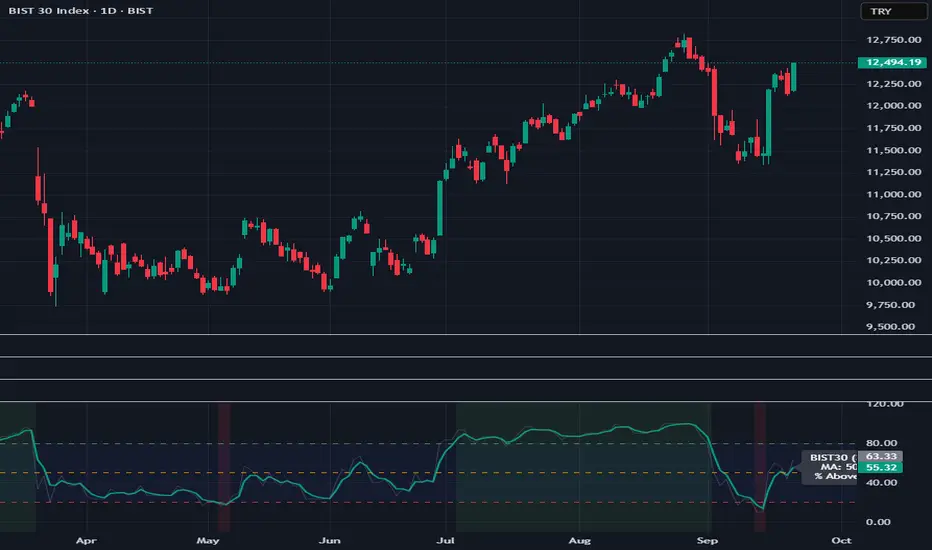
BIST30 % Above Moving Average (Breadth)
This indicator shows the percentage of BIST30 stocks trading above a selected moving average.
It is a market breadth tool, designed to measure the overall health and participation of the market.
How it works
By default, it uses the 50-day SMA.
You can switch between SMA/EMA and choose different periods (5 / 20 / 50 / 200).
The script checks each BIST30 stock individually and counts how many are closing above the chosen MA.
Interpretation
Above 80% → Overbought zone (short-term correction likely).
Below 20% → Oversold zone (potential rebound).
Around 50% → Neutral / indecisive market.
If the index (BIST:XU030) rises while this indicator falls → the rally is narrow-based, led by only a few stocks (a warning sign).
Use cases
Short-term traders → Use MA=5 or 20 for momentum signals.
Swing / Medium-term investors → Use MA=50 for market health.
Long-term investors → Use MA=200 to track bull/bear market cycles.
Notes
This script covers only BIST30 stocks by default.
The list can be updated for BIST100 or specific sectors (e.g., banks, industrials).
Breadth indicators should not be used as standalone buy/sell signals — combine them with price action, volume, and other technical tools for confirmation.
오픈 소스 스크립트
트레이딩뷰의 진정한 정신에 따라, 이 스크립트의 작성자는 이를 오픈소스로 공개하여 트레이더들이 기능을 검토하고 검증할 수 있도록 했습니다. 작성자에게 찬사를 보냅니다! 이 코드는 무료로 사용할 수 있지만, 코드를 재게시하는 경우 하우스 룰이 적용된다는 점을 기억하세요.
면책사항
해당 정보와 게시물은 금융, 투자, 트레이딩 또는 기타 유형의 조언이나 권장 사항으로 간주되지 않으며, 트레이딩뷰에서 제공하거나 보증하는 것이 아닙니다. 자세한 내용은 이용 약관을 참조하세요.
오픈 소스 스크립트
트레이딩뷰의 진정한 정신에 따라, 이 스크립트의 작성자는 이를 오픈소스로 공개하여 트레이더들이 기능을 검토하고 검증할 수 있도록 했습니다. 작성자에게 찬사를 보냅니다! 이 코드는 무료로 사용할 수 있지만, 코드를 재게시하는 경우 하우스 룰이 적용된다는 점을 기억하세요.
면책사항
해당 정보와 게시물은 금융, 투자, 트레이딩 또는 기타 유형의 조언이나 권장 사항으로 간주되지 않으며, 트레이딩뷰에서 제공하거나 보증하는 것이 아닙니다. 자세한 내용은 이용 약관을 참조하세요.