OPEN-SOURCE SCRIPT
Accumulation Swing Index (ASI)
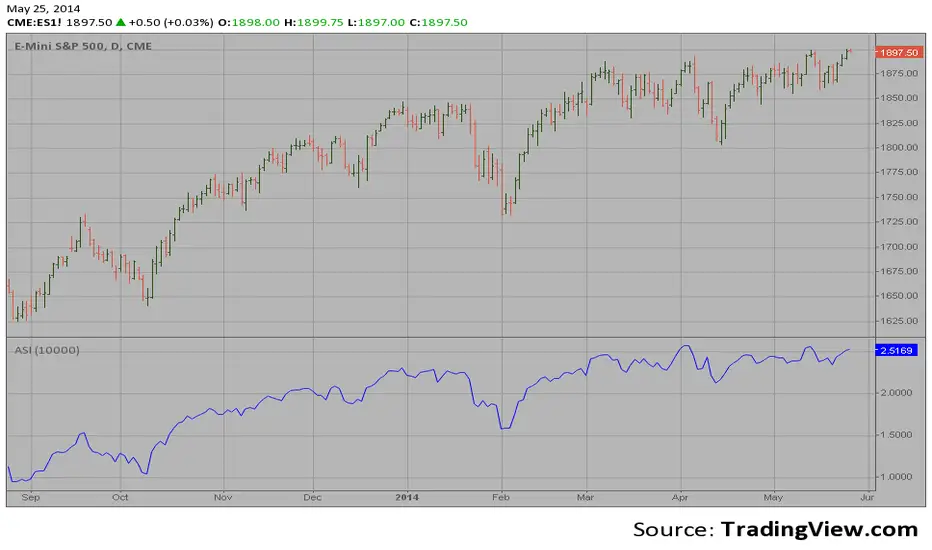
The Accumulation Swing Index is a cumulative total of the Swing Index.
The Accumulation Swing Index was developed by Welles Wilder.
The SwingIndex function was developed to help cut through the maze of
Open, High, Low and Close prices to indicate the real strength and direction
of the market. The Swing Index function looks at the Open, High, Low and
Close values for a two-bar period. The theory is that there are four cross-bar
and one intra-bar comparisons that are strong indicators of an up or down day.
The Swing Index returns a number between -100 and 100. If the factors point toward
an up day, then the function value will be positive and vice versa. In this way,
the Swing Index gives us definite short-term swing points, and it can be used to
supplement other methods as a breakout indicator. A breakout is indicated when the
value of the Accumulation Swing Index (ASI) exceeds the ASI value on the day when a
previous significant High Swing Point was made. A downside breakout is indicated when
the value of the ASI drops below the ASI value on a day when a previous significant
low swing point was made.
Since only futures have a relative daily limit value, this function only makes sense
when applied to a futures contract. If you use this function and it only plots a zero
flat line, check the Daily Limit value.
오픈 소스 스크립트
트레이딩뷰의 진정한 정신에 따라, 이 스크립트의 작성자는 이를 오픈소스로 공개하여 트레이더들이 기능을 검토하고 검증할 수 있도록 했습니다. 작성자에게 찬사를 보냅니다! 이 코드는 무료로 사용할 수 있지만, 코드를 재게시하는 경우 하우스 룰이 적용된다는 점을 기억하세요.
면책사항
해당 정보와 게시물은 금융, 투자, 트레이딩 또는 기타 유형의 조언이나 권장 사항으로 간주되지 않으며, 트레이딩뷰에서 제공하거나 보증하는 것이 아닙니다. 자세한 내용은 이용 약관을 참조하세요.
오픈 소스 스크립트
트레이딩뷰의 진정한 정신에 따라, 이 스크립트의 작성자는 이를 오픈소스로 공개하여 트레이더들이 기능을 검토하고 검증할 수 있도록 했습니다. 작성자에게 찬사를 보냅니다! 이 코드는 무료로 사용할 수 있지만, 코드를 재게시하는 경우 하우스 룰이 적용된다는 점을 기억하세요.
면책사항
해당 정보와 게시물은 금융, 투자, 트레이딩 또는 기타 유형의 조언이나 권장 사항으로 간주되지 않으며, 트레이딩뷰에서 제공하거나 보증하는 것이 아닙니다. 자세한 내용은 이용 약관을 참조하세요.