OPEN-SOURCE SCRIPT
업데이트됨 Half Candle Retrace
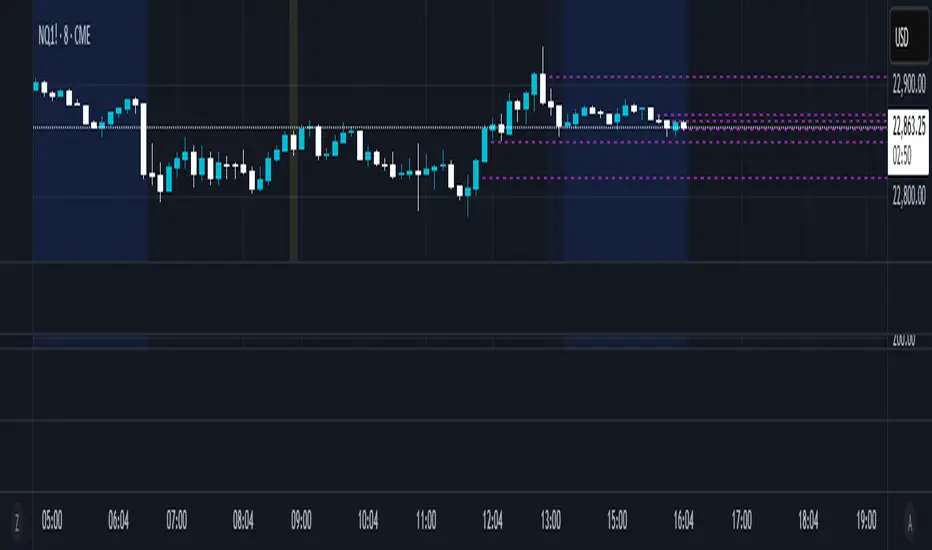
This custom indicator draws a horizontal line at the 50% retracement level of each candlestick on the chart. It calculates the midpoint between the high and low of each candle, which is often used by traders to identify potential entry, exit and take-profit levels. Once price action returns to an untouched level, the line will be removed, leaving only the levels where price action is still missing.
Key Features:
Timeframe: Works on all timeframes.
Line Color: Customize the line color to suit your charting preferences.
Line Width: Adjust the thickness of the retracement line for better visibility.
Line Style: Choose between solid, dotted, or dashed lines.
Up/Down Candle Selection: Option to only display retracement lines for up (bullish) candles, down (bearish) candles, or both.
Full Customization: Control the transparency (opacity) of the line for enhanced visual clarity.
Simple Setup: No complicated settings – simply choose your preferred color, line style, and visibility options.
This indicator is perfect for traders who prefer to use price action and retracement levels to identify potential trade opportunities.
How It Works:
The indicator automatically calculates the 50% level (midpoint) for each candlestick, drawing a line at this level. It will only draw lines for candles that match your chosen criteria (up or down candles), ensuring the chart remains clean and relevant to your trading strategy. Lines are automatically removed as soon as price crosses them.
릴리즈 노트
v2.0 - Added user input for showing current day only오픈 소스 스크립트
트레이딩뷰의 진정한 정신에 따라, 이 스크립트의 작성자는 이를 오픈소스로 공개하여 트레이더들이 기능을 검토하고 검증할 수 있도록 했습니다. 작성자에게 찬사를 보냅니다! 이 코드는 무료로 사용할 수 있지만, 코드를 재게시하는 경우 하우스 룰이 적용된다는 점을 기억하세요.
면책사항
해당 정보와 게시물은 금융, 투자, 트레이딩 또는 기타 유형의 조언이나 권장 사항으로 간주되지 않으며, 트레이딩뷰에서 제공하거나 보증하는 것이 아닙니다. 자세한 내용은 이용 약관을 참조하세요.
오픈 소스 스크립트
트레이딩뷰의 진정한 정신에 따라, 이 스크립트의 작성자는 이를 오픈소스로 공개하여 트레이더들이 기능을 검토하고 검증할 수 있도록 했습니다. 작성자에게 찬사를 보냅니다! 이 코드는 무료로 사용할 수 있지만, 코드를 재게시하는 경우 하우스 룰이 적용된다는 점을 기억하세요.
면책사항
해당 정보와 게시물은 금융, 투자, 트레이딩 또는 기타 유형의 조언이나 권장 사항으로 간주되지 않으며, 트레이딩뷰에서 제공하거나 보증하는 것이 아닙니다. 자세한 내용은 이용 약관을 참조하세요.