INVITE-ONLY SCRIPT
업데이트됨 Moonraker 1.3
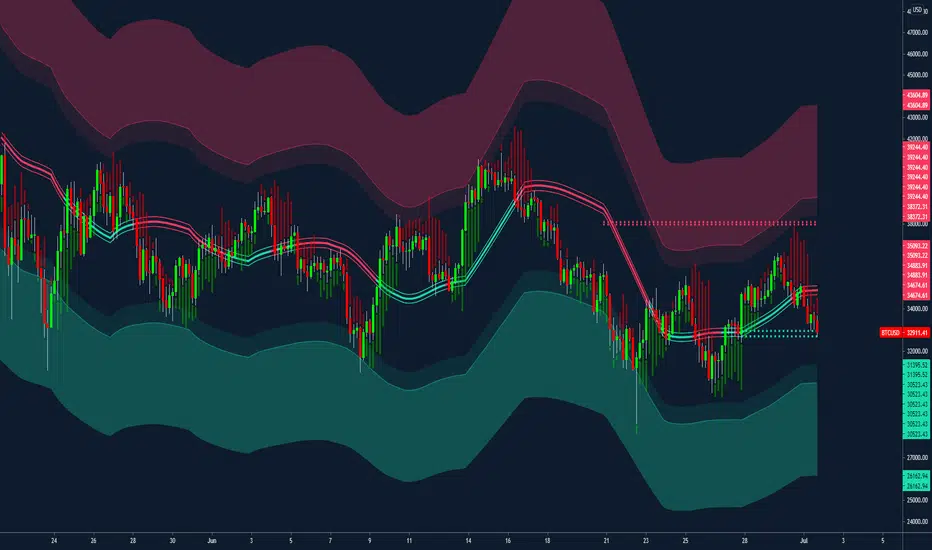
Bespoke Decentrader Mean Reversion Strategy
Colour coded mean line using price and volume
Volatility Bands
Major support and resistance plotted lines
Suggested dynamic hard stop placement
Built for all markets
A realistic strategy for multi-asset portfolio management
Complementary components to assist other indicators/strategies
Key D1 Strategy:
Designed for the 1D+ chart
The overall assumption is that price gravitates towards the mean
The intention is to remain in the market directionally as long as possible
1) Once the asset closes the period above the mean line the asset is considered to be bullish
2) Trader will wait and look to buy close to the developing mean line
3) Trader once filled, remains long
4) If price closes below the mean line, trader will place asks/sell orders close to the developing mean line
5) Trader moves asks along developing mean line until the trade is exited
6) Trader waits in a neutral position until condition 1) is met
Other strategy consideration ;
7) Support and resistance plotted lines can also be used to overrule condition 6) i.e. if the asset falls to a key support area AND trader has already exited, they can look to re-enter and be long to the mean line at which point condition 5) is met
8) Volatility bands can be used as a warning around the deviation from the mean line and probability of reversal
9) Hard stops can be used -> there is a general trade-off between volatility and remaining in the trade – Dynamic hard stops can be used if the trader wishes to add a layer of additional risk management to mitigate unusual volatile events. Should a stop be triggered, waiting for either condition 1) 7) or 8) are met before entering.
Other consideration;
- Works well alongside the Predator indicator; adding additional confluence to the strategy or identifying entries if predator is already within a trend where the initial entry was missed.
릴리즈 노트
Updated to include an alert function for Crossing the Mean / Crossing the deviation bands.릴리즈 노트
Updated to include:- Additional alerts from crossing upper and lower mean line band.
- Option to include Combined Bitcoin volume.
릴리즈 노트
Added optional momentum indicator to add confluence for entires. Also, please be aware that i have been made aware of a bug in the alerts previously added to please just test them at the moment.
릴리즈 노트
Updating to remove the other indicators from the chart or ill get into trouble off TV.릴리즈 노트
REMOVED BTCPAX FROM CODE AS REMOVED FROM BINANCE - REMOVE AND RE ADD SCRIPT릴리즈 노트
Volume Corrected릴리즈 노트
Removed combined btc volume to improve load times. 릴리즈 노트
Updated to define each of the line/band conditions for better definitions when making alerts. 초대 전용 스크립트
이 스크립트는 작성자가 승인한 사용자만 접근할 수 있습니다. 사용하려면 요청 후 승인을 받아야 하며, 일반적으로 결제 후에 허가가 부여됩니다. 자세한 내용은 아래 작성자의 안내를 따르거나 filbfilb에게 직접 문의하세요.
트레이딩뷰는 스크립트의 작동 방식을 충분히 이해하고 작성자를 완전히 신뢰하지 않는 이상, 해당 스크립트에 비용을 지불하거나 사용하는 것을 권장하지 않습니다. 커뮤니티 스크립트에서 무료 오픈소스 대안을 찾아보실 수도 있습니다.
작성자 지시 사항
Access via decentrader.com as of 28th June 2021
면책사항
해당 정보와 게시물은 금융, 투자, 트레이딩 또는 기타 유형의 조언이나 권장 사항으로 간주되지 않으며, 트레이딩뷰에서 제공하거나 보증하는 것이 아닙니다. 자세한 내용은 이용 약관을 참조하세요.
초대 전용 스크립트
이 스크립트는 작성자가 승인한 사용자만 접근할 수 있습니다. 사용하려면 요청 후 승인을 받아야 하며, 일반적으로 결제 후에 허가가 부여됩니다. 자세한 내용은 아래 작성자의 안내를 따르거나 filbfilb에게 직접 문의하세요.
트레이딩뷰는 스크립트의 작동 방식을 충분히 이해하고 작성자를 완전히 신뢰하지 않는 이상, 해당 스크립트에 비용을 지불하거나 사용하는 것을 권장하지 않습니다. 커뮤니티 스크립트에서 무료 오픈소스 대안을 찾아보실 수도 있습니다.
작성자 지시 사항
Access via decentrader.com as of 28th June 2021
면책사항
해당 정보와 게시물은 금융, 투자, 트레이딩 또는 기타 유형의 조언이나 권장 사항으로 간주되지 않으며, 트레이딩뷰에서 제공하거나 보증하는 것이 아닙니다. 자세한 내용은 이용 약관을 참조하세요.