OPEN-SOURCE SCRIPT
Failed 2U/2D + 50% Retrace Scanner
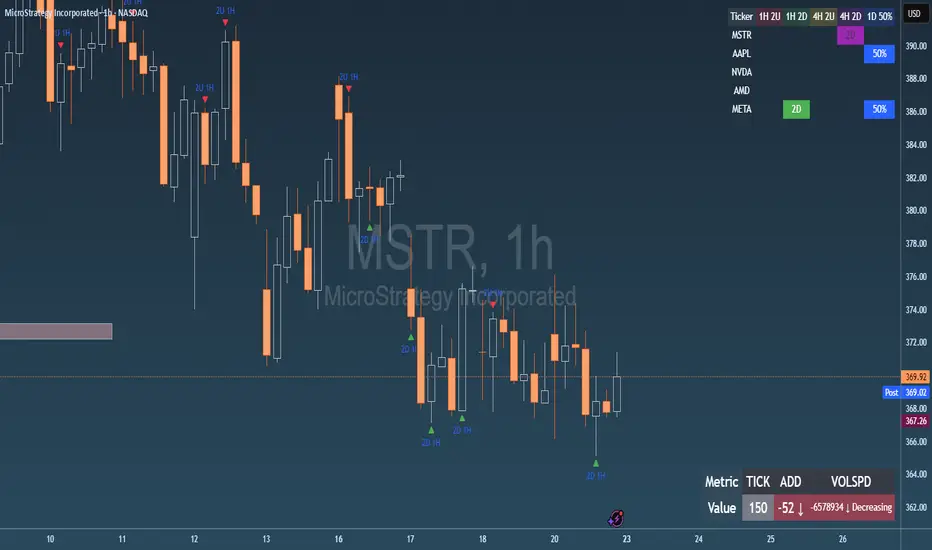
📈 Multi-Ticker Failed 2U/2D Scanner with Daily Retrace & Market Breadth Table
This TradingView indicator is a multi-symbol price action scanner designed to catch high-probability reversal signals using The Strat’s failed 2U/2D patterns and daily 50% retrace logic, while also displaying market breadth metrics ( TICK and ADD) for context.
Monitored Symbols:
SPY, SPX, QQQ, IWM, NVDA, AMD, AAPL, META, MSTR
🔍 Detection Logic
1. Failed 2U / Failed 2D Setups
Failed 2U: Price breaks above the previous candle’s high but closes back below the open → Bearish reversal
Failed 2D: Price breaks below the previous candle’s low but closes back above the open → Bullish reversal
Timeframes Monitored:
🕐 1-Hour (1H)
⏰ 4-Hour (4H)
2. Daily 50% Candle Retrace
Checks if price has retraced 50% or more of the previous day’s candle body
Highlights potential trend exhaustion or reversal confluence
3. Market Breadth Metrics (Display Only)
TICK: Measures real-time NYSE up vs. down ticks
ADD: Advance-Decline Line (net advancing stocks)
Not used in signal logic — just displayed in the table for overall market context
🖼️ Visual Elements
✅ Chart Markers
🔺 Red/Green Arrows for 1H Failed 2U/2D
🟨 Yellow Squares for 4H Failed 2U/2D
Visual markers are plotted directly on the relevant candles
📊 Signal Table
Lists all 9 tickers in rows
Columns for:
1H Signal
4H Signal
Daily 50% Retrace
TICK Value
ADD Value
Color-Coded Cells:
🔴 Red = Failed 2U
🟢 Green = Failed 2D
⚠️ Highlight if 50% Daily Retrace condition is true
🟦 Neutral-colored cells for TICK/ADD numeric display
🔔 Alerts
Hardcoded alerts fire when:
A 1H or 4H Failed 2U/2D is detected
The Daily 50% retrace condition is met
Each alert is labeled clearly by symbol and timeframe:
"META 4H Failed 2D"
"AAPL Daily 50% Retrace"
🎯 Use Case
Built for:
Reversal traders using The Strat
Swing or intraday traders watching hourly setups
Traders wanting quick visual context on market breadth without relying on it for confirmation
Monitoring multiple tickers in one clean view
This is scan 2
Add scan 1 for spx, spy, iwm, qqq, aapl
This indicator is not financial advice. Use the alerts to check out chart and when tickers trigger.
This TradingView indicator is a multi-symbol price action scanner designed to catch high-probability reversal signals using The Strat’s failed 2U/2D patterns and daily 50% retrace logic, while also displaying market breadth metrics (
Monitored Symbols:
SPY, SPX, QQQ, IWM, NVDA, AMD, AAPL, META, MSTR
🔍 Detection Logic
1. Failed 2U / Failed 2D Setups
Failed 2U: Price breaks above the previous candle’s high but closes back below the open → Bearish reversal
Failed 2D: Price breaks below the previous candle’s low but closes back above the open → Bullish reversal
Timeframes Monitored:
🕐 1-Hour (1H)
⏰ 4-Hour (4H)
2. Daily 50% Candle Retrace
Checks if price has retraced 50% or more of the previous day’s candle body
Highlights potential trend exhaustion or reversal confluence
3. Market Breadth Metrics (Display Only)
Not used in signal logic — just displayed in the table for overall market context
🖼️ Visual Elements
✅ Chart Markers
🔺 Red/Green Arrows for 1H Failed 2U/2D
🟨 Yellow Squares for 4H Failed 2U/2D
Visual markers are plotted directly on the relevant candles
📊 Signal Table
Lists all 9 tickers in rows
Columns for:
1H Signal
4H Signal
Daily 50% Retrace
Color-Coded Cells:
🔴 Red = Failed 2U
🟢 Green = Failed 2D
⚠️ Highlight if 50% Daily Retrace condition is true
🟦 Neutral-colored cells for TICK/ADD numeric display
🔔 Alerts
Hardcoded alerts fire when:
A 1H or 4H Failed 2U/2D is detected
The Daily 50% retrace condition is met
Each alert is labeled clearly by symbol and timeframe:
"META 4H Failed 2D"
"AAPL Daily 50% Retrace"
🎯 Use Case
Built for:
Reversal traders using The Strat
Swing or intraday traders watching hourly setups
Traders wanting quick visual context on market breadth without relying on it for confirmation
Monitoring multiple tickers in one clean view
This is scan 2
Add scan 1 for spx, spy, iwm, qqq, aapl
This indicator is not financial advice. Use the alerts to check out chart and when tickers trigger.
오픈 소스 스크립트
트레이딩뷰의 진정한 정신에 따라, 이 스크립트의 작성자는 이를 오픈소스로 공개하여 트레이더들이 기능을 검토하고 검증할 수 있도록 했습니다. 작성자에게 찬사를 보냅니다! 이 코드는 무료로 사용할 수 있지만, 코드를 재게시하는 경우 하우스 룰이 적용된다는 점을 기억하세요.
면책사항
해당 정보와 게시물은 금융, 투자, 트레이딩 또는 기타 유형의 조언이나 권장 사항으로 간주되지 않으며, 트레이딩뷰에서 제공하거나 보증하는 것이 아닙니다. 자세한 내용은 이용 약관을 참조하세요.
오픈 소스 스크립트
트레이딩뷰의 진정한 정신에 따라, 이 스크립트의 작성자는 이를 오픈소스로 공개하여 트레이더들이 기능을 검토하고 검증할 수 있도록 했습니다. 작성자에게 찬사를 보냅니다! 이 코드는 무료로 사용할 수 있지만, 코드를 재게시하는 경우 하우스 룰이 적용된다는 점을 기억하세요.
면책사항
해당 정보와 게시물은 금융, 투자, 트레이딩 또는 기타 유형의 조언이나 권장 사항으로 간주되지 않으며, 트레이딩뷰에서 제공하거나 보증하는 것이 아닙니다. 자세한 내용은 이용 약관을 참조하세요.