OPEN-SOURCE SCRIPT
PriorRange v0.3 [OmarxQQQ/dc_77]
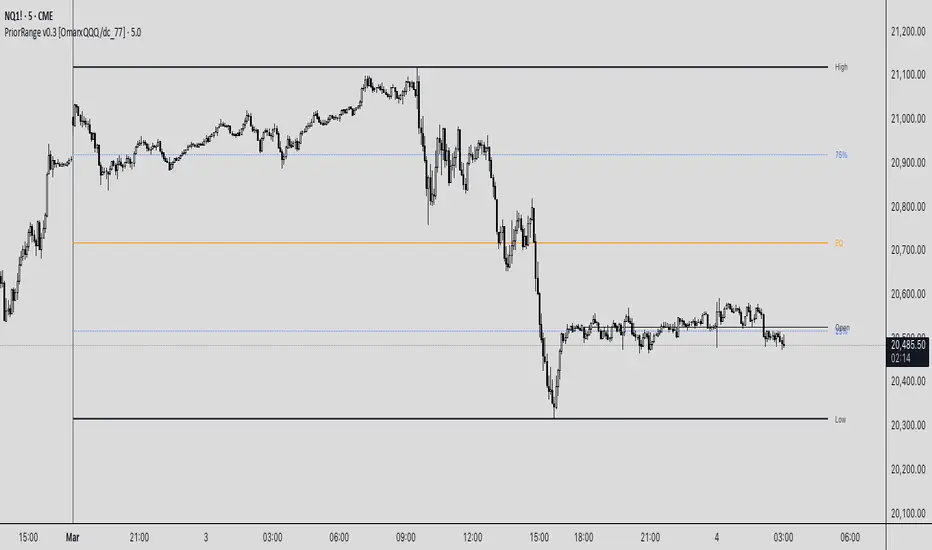
PriorRangeLevels is a versatile indicator that plots key price levels based on prior period ranges across multiple timeframes. This tool helps traders identify potential support, resistance, and breakout zones by displaying the High, Low, 75%, 50% (EQ), and 25% levels from the previous period.
Key Features:
- Multi-timeframe analysis from 1-minute to Monthly charts
- Time zone flexibility with options for major global markets (NYC, London, Tokyo, etc.)
- Customizable display for each level (High, Low, 75%, EQ, 25%, Open)
- Clean, organized settings interface with grouped options
- Anchor line marking the start of prior periods
- Current period open price reference
How It Works:
The indicator detects new periods based on your selected timeframe and calculates the range of the previous period. It then plots horizontal lines at the High, Low, and three internal levels (75%, 50%, 25%) extending forward by your specified number of bars. These levels serve as potential support/resistance zones and decision points for your trading strategy.
Trading Applications:
- Use High/Low levels as potential breakout targets or reversal zones
- Monitor price reaction to the EQ (50%) level to gauge trend strength
- Identify intraday support/resistance based on previous period ranges
- Plan entries and exits around established market structure
Each component can be individually customized with different line styles, colors, and widths to match your chart preferences and analytical needs.
Originally created by dc_77 with enhanced organization, multi-timeframe capabilities, and improved user interface. As Requested by many people.
populi a populo pro populo
GLGT
오픈 소스 스크립트
트레이딩뷰의 진정한 정신에 따라, 이 스크립트의 작성자는 이를 오픈소스로 공개하여 트레이더들이 기능을 검토하고 검증할 수 있도록 했습니다. 작성자에게 찬사를 보냅니다! 이 코드는 무료로 사용할 수 있지만, 코드를 재게시하는 경우 하우스 룰이 적용된다는 점을 기억하세요.
Making haste Slowly
면책사항
해당 정보와 게시물은 금융, 투자, 트레이딩 또는 기타 유형의 조언이나 권장 사항으로 간주되지 않으며, 트레이딩뷰에서 제공하거나 보증하는 것이 아닙니다. 자세한 내용은 이용 약관을 참조하세요.
오픈 소스 스크립트
트레이딩뷰의 진정한 정신에 따라, 이 스크립트의 작성자는 이를 오픈소스로 공개하여 트레이더들이 기능을 검토하고 검증할 수 있도록 했습니다. 작성자에게 찬사를 보냅니다! 이 코드는 무료로 사용할 수 있지만, 코드를 재게시하는 경우 하우스 룰이 적용된다는 점을 기억하세요.
Making haste Slowly
면책사항
해당 정보와 게시물은 금융, 투자, 트레이딩 또는 기타 유형의 조언이나 권장 사항으로 간주되지 않으며, 트레이딩뷰에서 제공하거나 보증하는 것이 아닙니다. 자세한 내용은 이용 약관을 참조하세요.