OPEN-SOURCE SCRIPT
MA Rainbow-AYNET
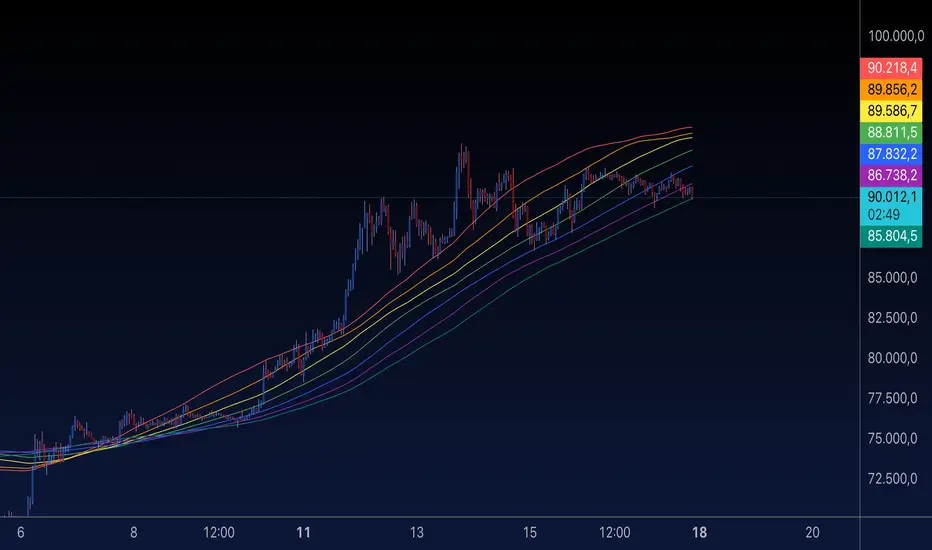
Summary of the "MA Rainbow"
The 200 MA Rainbow script creates a visually appealing representation of multiple moving averages (MAs) with varying lengths and colors to provide insights into price trends and market momentum.
Key Features:
Base Moving Average:
A starting point (ma_length, default 200) is used as the foundation for all other bands.
Rainbow Bands:
The script generates multiple moving averages (bands) with increasing lengths, spaced by a user-defined band_spacing multiplier.
The number of bands is controlled by rainbow_bands, allowing up to 7 bands.
Moving Average Types:
Users can select the MA type: Simple (SMA), Exponential (EMA), or Weighted (WMA).
Dynamic Colors:
Each band is assigned a unique color from a predefined rainbow palette, making the chart visually distinct.
Inputs for Customization:
ma_length: Adjust the base period of the moving average.
rainbow_bands: Set the number of bands to display.
band_spacing: Control the spread between bands.
How It Works:
Precomputing Bands:
Each band’s length is calculated based on the base length (ma_length) and a multiplier (band_spacing).
For example, if ma_length = 200 and band_spacing = 0.2, the lengths of the first 3 bands will be:
Band 1: 200
Band 2: 240
Band 3: 280
Global Plotting:
Each band’s moving average is precomputed using the selected type (SMA, EMA, or WMA).
Bands are plotted globally to avoid scope issues, ensuring compatibility with Pine Script rules.
Color Cycling:
Colors are assigned dynamically from a rainbow palette (red, orange, yellow, green, blue, purple, teal).
Use Case:
The 200 MA Rainbow helps traders:
Visualize market trends with multiple layers of moving averages.
Identify areas of support and resistance.
Gauge momentum through the spread and alignment of bands.
Customization:
Users can:
Change the base moving average length (ma_length).
Adjust the number of bands (rainbow_bands).
Control the spread between bands with band_spacing.
Select the moving average type (SMA, EMA, WMA).
Application:
Copy the script into the Pine Editor in TradingView.
Apply it to your chart to observe the Rainbow MA visualization.
Adjust inputs to match your trading style or strategy.
This script is a versatile tool for both beginner and advanced traders, providing a colorful way to track price trends and market conditions. 🌈
오픈 소스 스크립트
트레이딩뷰의 진정한 정신에 따라, 이 스크립트의 작성자는 이를 오픈소스로 공개하여 트레이더들이 기능을 검토하고 검증할 수 있도록 했습니다. 작성자에게 찬사를 보냅니다! 이 코드는 무료로 사용할 수 있지만, 코드를 재게시하는 경우 하우스 룰이 적용된다는 점을 기억하세요.
면책사항
해당 정보와 게시물은 금융, 투자, 트레이딩 또는 기타 유형의 조언이나 권장 사항으로 간주되지 않으며, 트레이딩뷰에서 제공하거나 보증하는 것이 아닙니다. 자세한 내용은 이용 약관을 참조하세요.
오픈 소스 스크립트
트레이딩뷰의 진정한 정신에 따라, 이 스크립트의 작성자는 이를 오픈소스로 공개하여 트레이더들이 기능을 검토하고 검증할 수 있도록 했습니다. 작성자에게 찬사를 보냅니다! 이 코드는 무료로 사용할 수 있지만, 코드를 재게시하는 경우 하우스 룰이 적용된다는 점을 기억하세요.
면책사항
해당 정보와 게시물은 금융, 투자, 트레이딩 또는 기타 유형의 조언이나 권장 사항으로 간주되지 않으며, 트레이딩뷰에서 제공하거나 보증하는 것이 아닙니다. 자세한 내용은 이용 약관을 참조하세요.