OPEN-SOURCE SCRIPT
업데이트됨 Volatility Adjusted Momentum Signal ETH (VAMS)
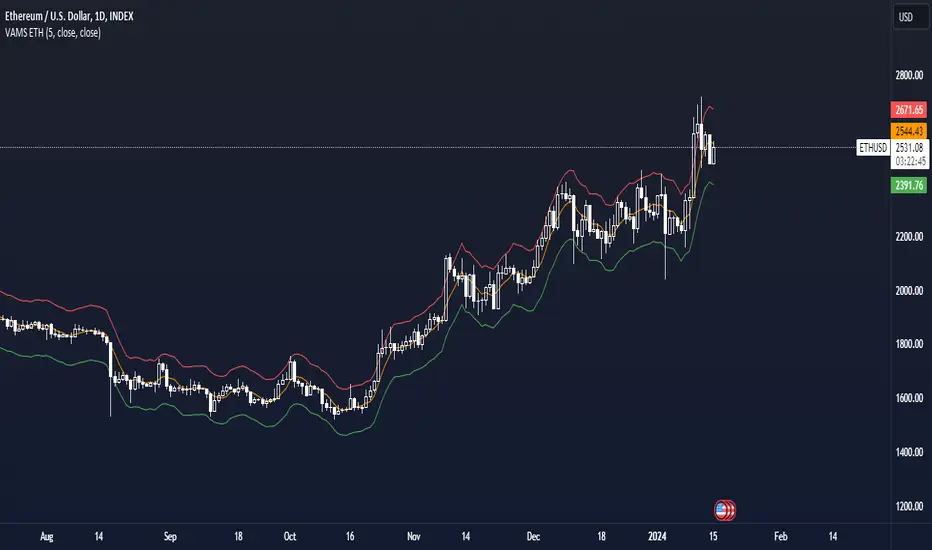
The VAMS ETH indicator is a technical analysis tool designed for Ethereum that aims to provide traders with insights into potential price momentum based on volatility-adjusted price ranges. This indicator is especially useful for identifying periods where the price is likely to experience significant movements away from a defined mean price level.
Key Functions
Volatility Measurement It utilizes a short-term lookback period to measure volatility, calculated as the standard deviation of the closing prices over the user-defined period.
Mean Price Calculation
Simultaneously, it computes the average closing price over the same lookback period to establish a baseline for the current price.
Probable Range Estimation
Using predefined mean percentage changes, the indicator calculates upper and lower boundaries that represent the probable range for price movements. These boundaries are adjusted for volatility, providing a dynamic perspective on where the price is in relation to typical fluctuations.
Signal Visualization
The lower and upper boundaries are plotted on the chart, color-coded in green and red, respectively. These plots help visualize zones where the price might be considered overextended or undervalued based on recent volatility.
The VAMS indicator allows for customization of the lookback period, enabling traders to adjust the sensitivity of the volatility measurement to match their trading style.
릴리즈 노트
Added plot for the mean priceAdded input for the source of the mean price and volatility
릴리즈 노트
Cleaned script code오픈 소스 스크립트
트레이딩뷰의 진정한 정신에 따라, 이 스크립트의 작성자는 이를 오픈소스로 공개하여 트레이더들이 기능을 검토하고 검증할 수 있도록 했습니다. 작성자에게 찬사를 보냅니다! 이 코드는 무료로 사용할 수 있지만, 코드를 재게시하는 경우 하우스 룰이 적용된다는 점을 기억하세요.
🔍 Access Investing Strategies & Indicators
📊 whop.com/marktquant
🌐 marktquant.com
Nothing shared on this page constitutes financial advice. All information, tools, and analyses are provided solely for informational and educational purposes.
📊 whop.com/marktquant
🌐 marktquant.com
Nothing shared on this page constitutes financial advice. All information, tools, and analyses are provided solely for informational and educational purposes.
면책사항
해당 정보와 게시물은 금융, 투자, 트레이딩 또는 기타 유형의 조언이나 권장 사항으로 간주되지 않으며, 트레이딩뷰에서 제공하거나 보증하는 것이 아닙니다. 자세한 내용은 이용 약관을 참조하세요.
오픈 소스 스크립트
트레이딩뷰의 진정한 정신에 따라, 이 스크립트의 작성자는 이를 오픈소스로 공개하여 트레이더들이 기능을 검토하고 검증할 수 있도록 했습니다. 작성자에게 찬사를 보냅니다! 이 코드는 무료로 사용할 수 있지만, 코드를 재게시하는 경우 하우스 룰이 적용된다는 점을 기억하세요.
🔍 Access Investing Strategies & Indicators
📊 whop.com/marktquant
🌐 marktquant.com
Nothing shared on this page constitutes financial advice. All information, tools, and analyses are provided solely for informational and educational purposes.
📊 whop.com/marktquant
🌐 marktquant.com
Nothing shared on this page constitutes financial advice. All information, tools, and analyses are provided solely for informational and educational purposes.
면책사항
해당 정보와 게시물은 금융, 투자, 트레이딩 또는 기타 유형의 조언이나 권장 사항으로 간주되지 않으며, 트레이딩뷰에서 제공하거나 보증하는 것이 아닙니다. 자세한 내용은 이용 약관을 참조하세요.