PROTECTED SOURCE SCRIPT
EMA 9/21/50/200
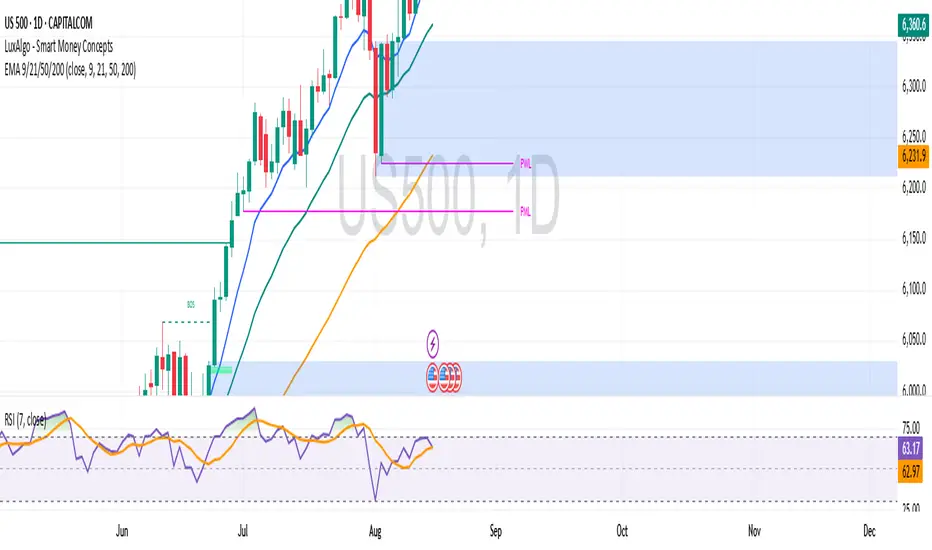
🔹 EMA 9 (Fastest EMA)
Short-term momentum tracker
Reacts quickly to price changes (follows candles closely).
Often used by scalpers and day traders for quick entries/exits.
Above price → short-term bullish push; below price → short-term bearish push.
🔹 EMA 21 (Short-Term Trend)
Short-to-medium-term trend indicator.
Commonly used on 15m, 1h, and 4h charts for swing entries.
Works as a dynamic support/resistance in trending markets.
EMA 9 crossing above/below EMA 21 = strong buy/sell signal.
🔹 EMA 50 (Medium-Term Trend)
Used to gauge the overall market trend for the past few weeks.
Many traders look at price relative to the EMA 50:
Above → bullish bias.
Below → bearish bias.
Acts as a stronger support/resistance than EMA 21.
🔹 EMA 200 (Long-Term Trend)
The big picture trend indicator (months of data).
Widely followed by institutions and big players.
If price is above EMA 200 → long-term bullish market.
If price is below EMA 200 → long-term bearish market.
Very powerful support/resistance line → many swing traders and investors use it as the ultimate trend filter.
🔀 How Traders Use Them Together
Trend Confirmation:
Bullish if EMA 9 > 21 > 50 > 200 (stacked in order).
Bearish if EMA 9 < 21 < 50 < 200.
Crossover Signals:
EMA 9 crossing EMA 21 = short-term entry/exit signal.
EMA 50 vs EMA 200 (the “Golden Cross” / “Death Cross”) shows major shifts.
Dynamic Support/Resistance:
Price often pulls back to EMAs before continuing trend → good entry zones.
✅ In simple terms:
EMA 9 & 21 → short-term trading signals.
EMA 50 → medium-term trend confirmation.
EMA 200 → long-term trend direction (the “line in the sand”).
보호된 스크립트입니다
이 스크립트는 비공개 소스로 게시됩니다. 하지만 제한 없이 자유롭게 사용할 수 있습니다 — 여기에서 자세히 알아보기.
면책사항
이 정보와 게시물은 TradingView에서 제공하거나 보증하는 금융, 투자, 거래 또는 기타 유형의 조언이나 권고 사항을 의미하거나 구성하지 않습니다. 자세한 내용은 이용 약관을 참고하세요.
보호된 스크립트입니다
이 스크립트는 비공개 소스로 게시됩니다. 하지만 제한 없이 자유롭게 사용할 수 있습니다 — 여기에서 자세히 알아보기.
면책사항
이 정보와 게시물은 TradingView에서 제공하거나 보증하는 금융, 투자, 거래 또는 기타 유형의 조언이나 권고 사항을 의미하거나 구성하지 않습니다. 자세한 내용은 이용 약관을 참고하세요.