OPEN-SOURCE SCRIPT
업데이트됨 Dynamic Bern Trail

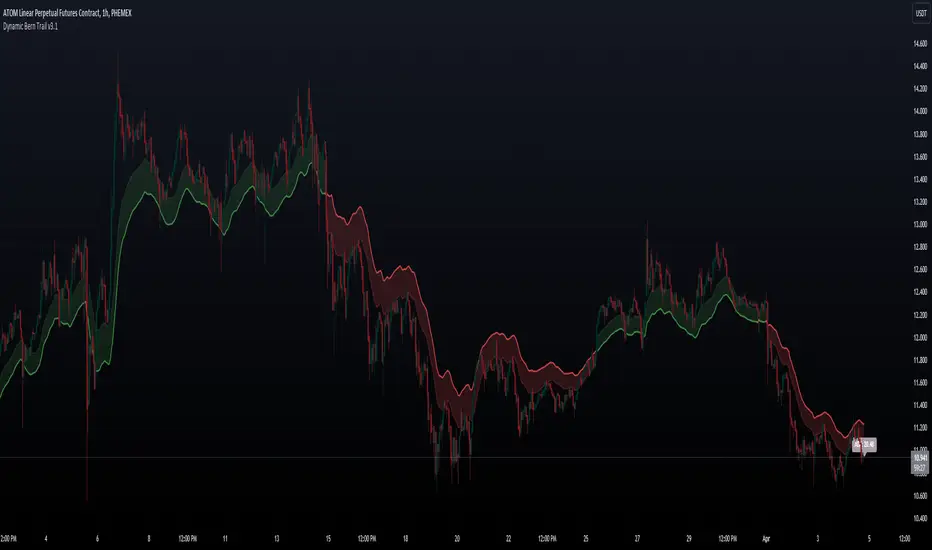
This indicator will help you following price movements in trending or ranging markets. Within it's calculations it uses ATR, EMA with a smoothing effect. It includes a buffer zone to help determine where price may turn around and reverse or to identify when a breakout occurs by breaking through the ATR trail. You can customize and play around with several settings to adjust it for your asset. Adjustments that can be made besides visuals are ATR Length, ATR Multiplier, EMA Length, Smoothing Length and the Buffer Multiplier.
릴리즈 노트
Multi-timeframe added. Also you can now choose between EMA, SMA, RMA, HMA, DEMA and TMA for the main plot. When first created only the EMA was used, so you might have to change some of the other settings when choosing your desired Moving average.릴리즈 노트
Added a current "ADX" label level reading. It will update with each new bar that is produced. (So be careful on higher timeframes) 50 and above is Blue = "Really strong trend"
50 - 25 is Purple = "Strong trend"
25 - 20 is Gray = "Neutral" Keep an eye out.
20 and Below is Red =" Weak or no trend"
Note: Please remember the ADX does not keep trend direction in mind, you can have a high reading of 50 and price is decreasing. Meaning its a strong trend to the downside.
You can switch the ADX label On/Off.
릴리즈 노트
Clean code.릴리즈 노트
Typo fixed.릴리즈 노트
Added VWMA and WMA to the MA Type options.오픈 소스 스크립트
트레이딩뷰의 진정한 정신에 따라, 이 스크립트의 작성자는 이를 오픈소스로 공개하여 트레이더들이 기능을 검토하고 검증할 수 있도록 했습니다. 작성자에게 찬사를 보냅니다! 이 코드는 무료로 사용할 수 있지만, 코드를 재게시하는 경우 하우스 룰이 적용된다는 점을 기억하세요.
면책사항
해당 정보와 게시물은 금융, 투자, 트레이딩 또는 기타 유형의 조언이나 권장 사항으로 간주되지 않으며, 트레이딩뷰에서 제공하거나 보증하는 것이 아닙니다. 자세한 내용은 이용 약관을 참조하세요.
오픈 소스 스크립트
트레이딩뷰의 진정한 정신에 따라, 이 스크립트의 작성자는 이를 오픈소스로 공개하여 트레이더들이 기능을 검토하고 검증할 수 있도록 했습니다. 작성자에게 찬사를 보냅니다! 이 코드는 무료로 사용할 수 있지만, 코드를 재게시하는 경우 하우스 룰이 적용된다는 점을 기억하세요.
면책사항
해당 정보와 게시물은 금융, 투자, 트레이딩 또는 기타 유형의 조언이나 권장 사항으로 간주되지 않으며, 트레이딩뷰에서 제공하거나 보증하는 것이 아닙니다. 자세한 내용은 이용 약관을 참조하세요.