OPEN-SOURCE SCRIPT
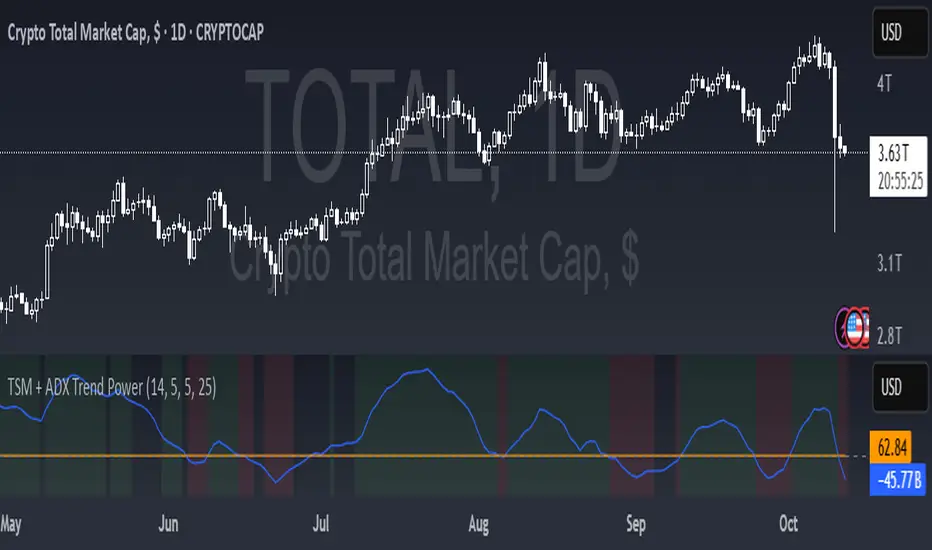
TSM + ADX Trend Power

Logic Behind This Indicator
This indicator combines two momentum/trend tools to identify strong, reliable trends in price movement:
1. TSM (Time Series Momentum)
What it does: Measures the difference between the current price and a smoothed average of past prices.
Formula: EMA(close - EMA(close, 14), 14)
Logic:
If TSM > 0 → Price is above its recent average = upward momentum
If TSM < 0 → Price is below its recent average = downward momentum
2. ADX (Average Directional Index)
What it does: Measures trend strength (not direction).
Logic:
ADX > 25 → Strong trend (either up or down)
ADX < 25 → Weak or no trend (choppy/sideways market)
Combined Logic (TSM + ADX)
The indicator only signals a trend when both conditions are met:
Condition Meaning
Uptrend TSM > 0 AND ADX > 25 → Strong upward momentum
Downtrend TSM < 0 AND ADX > 25 → Strong downward momentum
No signal ADX < 25 → Trend is too weak to trust
What It Aims to Detect
- Strong, sustained trends (not just noise or small moves)
- Filters out weak/choppy markets where momentum indicators often give false signals
- Entry/exit points:
- Green background = Strong uptrend (consider buying/holding)
- Red background = Strong downtrend (consider selling/shorting)
- No color = Weak trend (stay out or wait)
오픈 소스 스크립트
트레이딩뷰의 진정한 정신에 따라, 이 스크립트의 작성자는 이를 오픈소스로 공개하여 트레이더들이 기능을 검토하고 검증할 수 있도록 했습니다. 작성자에게 찬사를 보냅니다! 이 코드는 무료로 사용할 수 있지만, 코드를 재게시하는 경우 하우스 룰이 적용된다는 점을 기억하세요.
면책사항
해당 정보와 게시물은 금융, 투자, 트레이딩 또는 기타 유형의 조언이나 권장 사항으로 간주되지 않으며, 트레이딩뷰에서 제공하거나 보증하는 것이 아닙니다. 자세한 내용은 이용 약관을 참조하세요.
오픈 소스 스크립트
트레이딩뷰의 진정한 정신에 따라, 이 스크립트의 작성자는 이를 오픈소스로 공개하여 트레이더들이 기능을 검토하고 검증할 수 있도록 했습니다. 작성자에게 찬사를 보냅니다! 이 코드는 무료로 사용할 수 있지만, 코드를 재게시하는 경우 하우스 룰이 적용된다는 점을 기억하세요.
면책사항
해당 정보와 게시물은 금융, 투자, 트레이딩 또는 기타 유형의 조언이나 권장 사항으로 간주되지 않으며, 트레이딩뷰에서 제공하거나 보증하는 것이 아닙니다. 자세한 내용은 이용 약관을 참조하세요.