OPEN-SOURCE SCRIPT
Bollinger Band Clouds [vnhilton]
I recommend to turn off 'Labels on price scale' & 'Values in status line' as this indicator's intended use is for visualizing volatility in the form of overextensions & pullbacks only.
Default settings for intraday use - however you can change various settings for your personal use.
Bollinger bands is a volatility indicator which plots X standard deviation bands away from the base moving average. When price isn't volatile, bands are compressed (closer to base moving average), & expand when volatility starts to increase - this makes Bollinger bands a great visual indicator for displaying volatility cycles. Although prices aren't normally distributed (i.e. 2 standard deviation bands won't mean 95% of price will lie within the bands), Bollinger bands can be useful to show strong abnormal trends when price is outside the bands, which can be seen as overextensions & will have to retrace sooner or later, towards the moving averages. Price trends within bands are seen as healthy trends (price grinds fit this description).
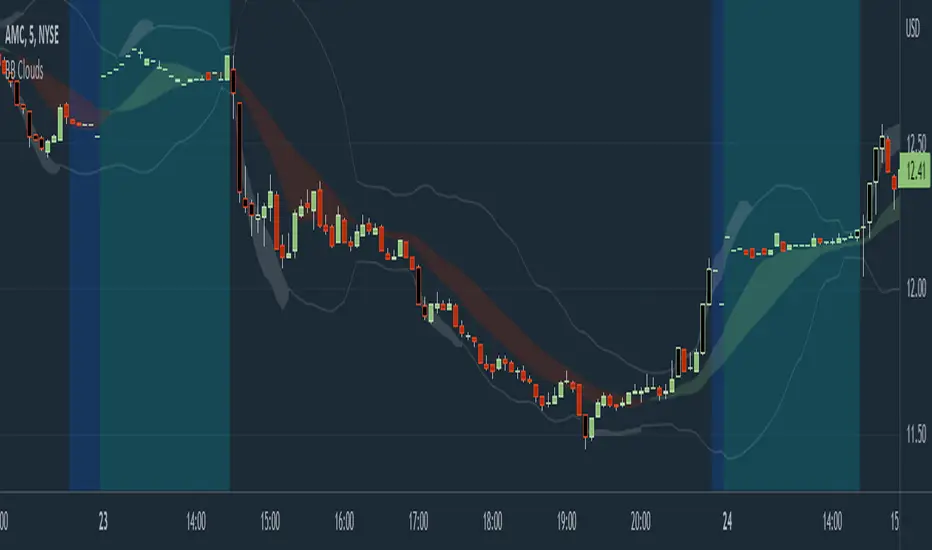
This indicator creates clouds (fill) between 2 different moving average standard deviation bands. The idea is to better visualize strong trends/overextensions as the shorter period standard deviation bands will be outside the longer period bands. This indicator also provides bar color changes for when the bar close is outside the longer period standard deviation bands to help illustrate the strong trends/overextensions. The chart snapshot image shows standard deviation clouds for a 10-20 period SMA. This indicator also allows for better visualization on pullbacks to the mean, by giving a MA cloud between the 2 short & long period MAs.
Default settings for intraday use - however you can change various settings for your personal use.
Bollinger bands is a volatility indicator which plots X standard deviation bands away from the base moving average. When price isn't volatile, bands are compressed (closer to base moving average), & expand when volatility starts to increase - this makes Bollinger bands a great visual indicator for displaying volatility cycles. Although prices aren't normally distributed (i.e. 2 standard deviation bands won't mean 95% of price will lie within the bands), Bollinger bands can be useful to show strong abnormal trends when price is outside the bands, which can be seen as overextensions & will have to retrace sooner or later, towards the moving averages. Price trends within bands are seen as healthy trends (price grinds fit this description).
This indicator creates clouds (fill) between 2 different moving average standard deviation bands. The idea is to better visualize strong trends/overextensions as the shorter period standard deviation bands will be outside the longer period bands. This indicator also provides bar color changes for when the bar close is outside the longer period standard deviation bands to help illustrate the strong trends/overextensions. The chart snapshot image shows standard deviation clouds for a 10-20 period SMA. This indicator also allows for better visualization on pullbacks to the mean, by giving a MA cloud between the 2 short & long period MAs.
오픈 소스 스크립트
진정한 트레이딩뷰 정신에 따라 이 스크립트 작성자는 트레이더가 기능을 검토하고 검증할 수 있도록 오픈소스로 공개했습니다. 작성자에게 찬사를 보냅니다! 무료로 사용할 수 있지만 코드를 다시 게시할 경우 하우스 룰이 적용된다는 점을 기억하세요.
면책사항
이 정보와 게시물은 TradingView에서 제공하거나 보증하는 금융, 투자, 거래 또는 기타 유형의 조언이나 권고 사항을 의미하거나 구성하지 않습니다. 자세한 내용은 이용 약관을 참고하세요.
오픈 소스 스크립트
진정한 트레이딩뷰 정신에 따라 이 스크립트 작성자는 트레이더가 기능을 검토하고 검증할 수 있도록 오픈소스로 공개했습니다. 작성자에게 찬사를 보냅니다! 무료로 사용할 수 있지만 코드를 다시 게시할 경우 하우스 룰이 적용된다는 점을 기억하세요.
면책사항
이 정보와 게시물은 TradingView에서 제공하거나 보증하는 금융, 투자, 거래 또는 기타 유형의 조언이나 권고 사항을 의미하거나 구성하지 않습니다. 자세한 내용은 이용 약관을 참고하세요.