PROTECTED SOURCE SCRIPT
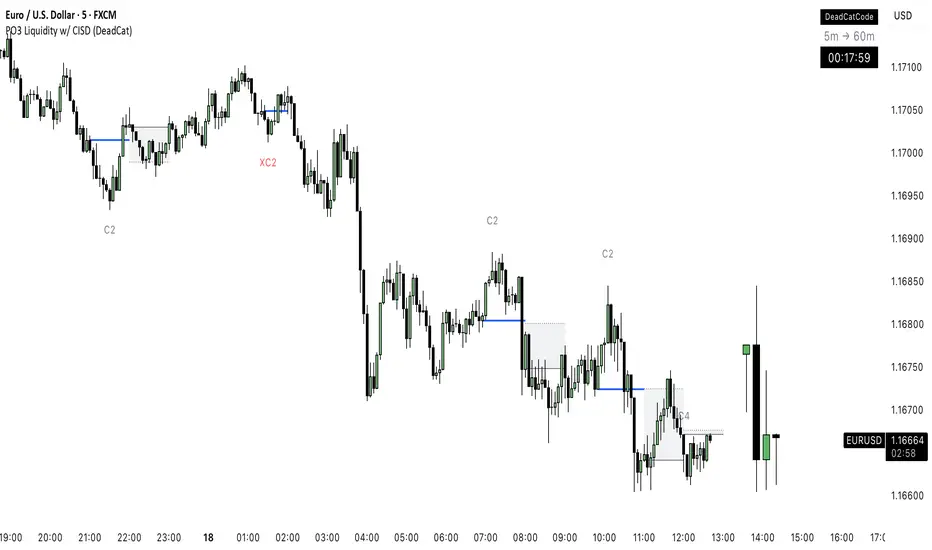
PO3 Liquidity w/ CISD (DeadCat)
Detailed Description:
What it does:
This indicator combines Power of Three (PO3) liquidity concepts with Change in State of Delivery (CISD) pattern recognition to identify high-probability trading setups. It automatically detects liquidity sweeps and confirms them through CISD patterns on higher timeframes.
How it works:
The script operates using a dual-timeframe approach:
Auto-Timeframe Selection: Automatically selects an appropriate higher timeframe based on your chart timeframe (1m→15m, 5m→1H, 15m→4H, etc.)
C2 Liquidity Detection: Identifies C2 setups when price sweeps below previous HTF lows (bullish) or above previous HTF highs (bearish), then closes back inside the previous range
CISD Pattern Recognition: Confirms C2 setups by detecting Change in State of Delivery patterns:
For bullish setups: Looks for bearish candles followed by bullish reclaim above the CISD level
For bearish setups: Looks for bullish candles followed by bearish rejection below the CISD level
Multi-Period Validation: Tracks setups across multiple HTF periods (up to 2 periods) before invalidation
Dynamic Zone Mapping: Creates trading zones between HTF open and equilibrium levels, with automatic C4 setup generation when conditions align
Key Features:
HTF Candle Visualization: Displays higher timeframe candles on your current chart for context
Trading Zones: Shows the optimal entry zone between HTF open and HTF equilibrium
CISD Confirmation Lines: Draws lines showing confirmed Change in State of Delivery levels
Setup Invalidation: Automatically marks setups as invalid (XC2/XC4) when stop levels are breached
Bias Filter: Allows filtering for bullish, bearish, or neutral bias
Real-time Countdown: Shows time remaining in current HTF period
Originality:
This script uniquely combines the Power of Three methodology with CISD pattern recognition in an automated format. Unlike simple liquidity sweep indicators, it requires confirmation through specific price action patterns and validates setups across multiple timeframes. The integration of automatic timeframe selection, zone mapping, and multi-period tracking creates a comprehensive tool that goes beyond basic liquidity concepts.
How to use it:
Apply to any timeframe (works best on 1m-4H charts)
Set your bias filter (Neutral for all setups, Bullish/Bearish for directional bias)
Wait for C2 labels to appear after liquidity sweeps
Look for confirmed CISD lines to validate the setup
Use the trading zones (boxes) for entry planning
Monitor for C4 setups on the second HTF period
Setup is invalidated if price hits the original sweep level (marked as XC2)
Warning:
This indicator uses higher timeframe data and may repaint on the current bar. Setups are only confirmed after HTF candle close. Not all C2 setups will be confirmed - confirmation requires proper CISD pattern development.
보호된 스크립트입니다
이 스크립트는 비공개 소스로 게시됩니다. 하지만 제한 없이 자유롭게 사용할 수 있습니다 — 여기에서 자세히 알아보기.
면책사항
이 정보와 게시물은 TradingView에서 제공하거나 보증하는 금융, 투자, 거래 또는 기타 유형의 조언이나 권고 사항을 의미하거나 구성하지 않습니다. 자세한 내용은 이용 약관을 참고하세요.
보호된 스크립트입니다
이 스크립트는 비공개 소스로 게시됩니다. 하지만 제한 없이 자유롭게 사용할 수 있습니다 — 여기에서 자세히 알아보기.
면책사항
이 정보와 게시물은 TradingView에서 제공하거나 보증하는 금융, 투자, 거래 또는 기타 유형의 조언이나 권고 사항을 의미하거나 구성하지 않습니다. 자세한 내용은 이용 약관을 참고하세요.