OPEN-SOURCE SCRIPT
업데이트됨 Flat & Trend MACD
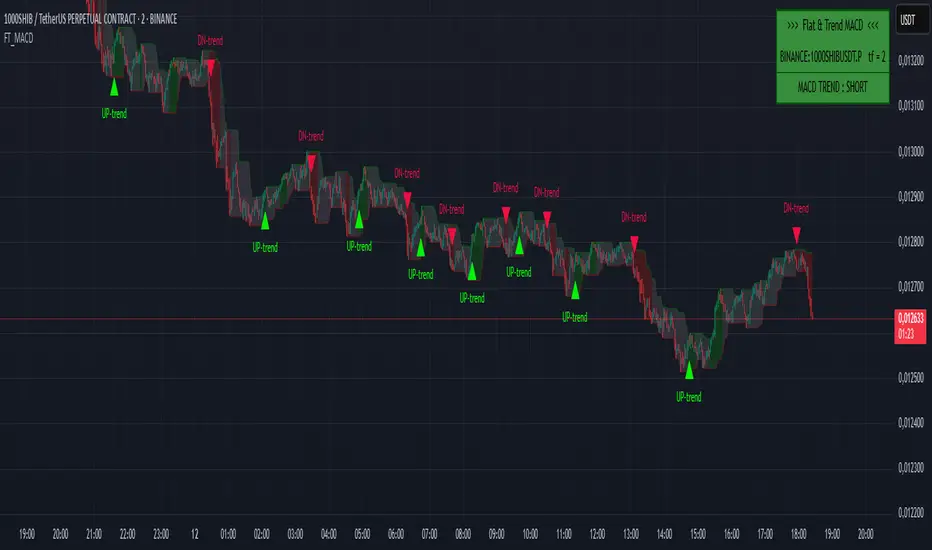
💡 The MACD indicator with trend interpretation and flat zones on top of the chart!
👉 This indicator clearly shows the zones of predominance of buyers, sellers, as well as zones of uncertainty (flat).
Suitable for any instrument and timeframe!
The MACD settings are standard.
The setup menu sets the length of Fast, Slow and smoothing for calculating the MACD oscillator.
🔹The indicator tracks the value of the MACD relative to zero, taking into account the uncertainty zone, which is calculated at 50% of the average value of the deviation of the MACD for a short period. This avoids most false buy and sell signals.
🔹When the MACD value is positive and goes beyond uncertainty, a buy signal appears (green triangle on the chart), when the MACD value is negative and goes beyond uncertainty, a sell signal appears (red triangle on the chart). The built-in alert gives a signal of a trend change.
Also, the trend direction is highlighted by the background color of the price channel on the chart.
🔹If the MACD value is in the zone of uncertainty of the buyer and seller, the background turns gray and an orange square appears on the chart. The built-in alert gives a signal about the beginning of the flat zone.
A scoreboard is displayed in the upper right corner, which shows the current status of the indicator and a warning about the presence of a flat.
The flat display can be disabled in the indicator settings.
The colors can be changed in the Style menu.
👉 I wish everyone a profit and be sure to follow risk management in trading!
For any questions, you can write to me in private messages or by the contacts in my signature.
===============================================
💡 Индикатор MACD с интерпретацией тренда и флэтовых зон поверх графика!
👉 Данный индикатор наглядно показывает зоны преобладания покупателей, продавцов, а также зоны неопределенности (флэт).
Подходит для любого инструмента и таймфрейма!
Параметры настройки MACD - стандартные.
В меню настройки задается длина Fast, Slow и сглаживание для расчета MACD-осциллятора.
🔹Индикатор отслеживает значение MACD относительно нуля с учётом зон неопределённости, которая расчитывается в 50% среднего значения отклонения MACD за небольшой период. Это позволяет избежать большинства ложных сигналов на покупку и продажу.
🔹Когда значение MACD является положительным и выходит за пределы неопределённости - появляется сигнал на покупку (зеленый треугольник на графике), когда значение MACD является отрицательным и выходит за пределы неопределённости - появляется сигнал на продажу (красный треугольник на графике). Встроенное оповещение дает сигнал о смене тренда.
Также направление тренда подсвечивается окраской фона ценового канала на графике.
🔹Если значение MACD находится в зоне неопределённости покупателя и продавца - фон окрашивается в серый цвет и на графике появляется оранжевый квадрат. Встроенное оповещение дает сигнал о начале зоны флэта.
В правом верхнем углу высвечивается табло, которое показывает текущий статус индикатора и предупреждение о наличии флэта.
Отображение флэта можно отключить в настройках индикатора.
Цвета можно изменить в меню "Стиль".
👉 Желаю всем профита и обязательно соблюдайте риск-менеджмент в торговле!
По любым вопросам Вы можете написать мне в личные сообщения или по контактам в моей подписи.
릴리즈 노트
> Update version on Pine 6> Added control of probable movement up and down (green and red triangles).
> Added control of probable end of movement (red cross).
> Added control of enabling notifications about trend change, flat zones, movements up/down.
> To start alerts, use - with any call to the alert() function
👉 I wish everyone a profit and be sure to follow risk management in trading!
For any questions, you can write to me in private messages or by the contacts in my signature.
릴리즈 노트
Added personalized alerts오픈 소스 스크립트
트레이딩뷰의 진정한 정신에 따라, 이 스크립트의 작성자는 이를 오픈소스로 공개하여 트레이더들이 기능을 검토하고 검증할 수 있도록 했습니다. 작성자에게 찬사를 보냅니다! 이 코드는 무료로 사용할 수 있지만, 코드를 재게시하는 경우 하우스 룰이 적용된다는 점을 기억하세요.
📌 Я в Telegram: t.me/Shuttle_trader
📌 Бесплатные сигналы: t.me/Your_easy_trade
📌 Бесплатные сигналы: t.me/Your_easy_trade
면책사항
해당 정보와 게시물은 금융, 투자, 트레이딩 또는 기타 유형의 조언이나 권장 사항으로 간주되지 않으며, 트레이딩뷰에서 제공하거나 보증하는 것이 아닙니다. 자세한 내용은 이용 약관을 참조하세요.
오픈 소스 스크립트
트레이딩뷰의 진정한 정신에 따라, 이 스크립트의 작성자는 이를 오픈소스로 공개하여 트레이더들이 기능을 검토하고 검증할 수 있도록 했습니다. 작성자에게 찬사를 보냅니다! 이 코드는 무료로 사용할 수 있지만, 코드를 재게시하는 경우 하우스 룰이 적용된다는 점을 기억하세요.
📌 Я в Telegram: t.me/Shuttle_trader
📌 Бесплатные сигналы: t.me/Your_easy_trade
📌 Бесплатные сигналы: t.me/Your_easy_trade
면책사항
해당 정보와 게시물은 금융, 투자, 트레이딩 또는 기타 유형의 조언이나 권장 사항으로 간주되지 않으며, 트레이딩뷰에서 제공하거나 보증하는 것이 아닙니다. 자세한 내용은 이용 약관을 참조하세요.