OPEN-SOURCE SCRIPT
Nadaraya-Watson Oscillator
This indicator is based on the work of jdehorty and his amazing Nadaraya-Watson Kernel Envelope, which you can see here:
https://www.tradingview.com/script/WeLssFxl-Nadaraya-Watson-Envelope-Non-Repainting/
General Description
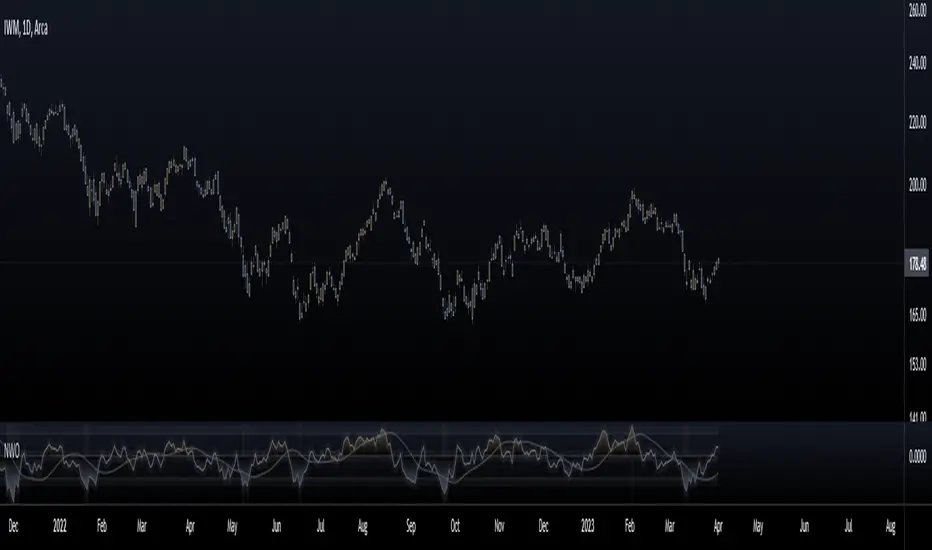
The Nadaraya-Watson Oscillator (NWO) will give the same information as the Nadaraya-Watson Envelope, but as an oscillator off the main chart, by plotting the relationship between price and the Kernel and its bands. This also means that we can now detect divergences between price and the NWO.
You can see the relationship between the two here:

You can think of this indicator as the kernel envelope version of a Bollinger Band %B. In ranging markets the bands are perfect for mean reversion trades, but in certain situations the break of one of the bands can signal the beggining of a strong trend and price will remain close to the bands for a long period and will only give small pullbacks. As with any indicator, confluence with price and other tools must be taken into account.
Main Features
As with jdehorty 's Envelope, you can change the following settings:
I also added the following:
Colors
Some special things to note regarding the coloring:
Happy trading!
https://www.tradingview.com/script/WeLssFxl-Nadaraya-Watson-Envelope-Non-Repainting/
General Description
The Nadaraya-Watson Oscillator (NWO) will give the same information as the Nadaraya-Watson Envelope, but as an oscillator off the main chart, by plotting the relationship between price and the Kernel and its bands. This also means that we can now detect divergences between price and the NWO.
You can see the relationship between the two here:
You can think of this indicator as the kernel envelope version of a Bollinger Band %B. In ranging markets the bands are perfect for mean reversion trades, but in certain situations the break of one of the bands can signal the beggining of a strong trend and price will remain close to the bands for a long period and will only give small pullbacks. As with any indicator, confluence with price and other tools must be taken into account.
Main Features
As with jdehorty 's Envelope, you can change the following settings:
- Lookback Window.
- Relative Weighting.
- The initial bar for the regression.
- ATR period for the bands.
- Inner and Outer Multiples for the bands.
I also added the following:
- A middle band around the Kernel to filter out false crossovers.
- A Hull Moving Average to smoothen out the movements of the oscillator and give extra confirmation of turnover points.
Colors
Some special things to note regarding the coloring:
- The zero line features a gradient that changes color every time the Kernel slope changes direction.
- The Oscillator plot has a gradient coloring that gets stronger the closer it gets to each of the bands.
- Every time the oscillator crosses over/under the outer bands the background will be highlighted.
Happy trading!
오픈 소스 스크립트
진정한 TradingView 정신에 따라, 이 스크립트의 저자는 트레이더들이 이해하고 검증할 수 있도록 오픈 소스로 공개했습니다. 저자에게 박수를 보냅니다! 이 코드는 무료로 사용할 수 있지만, 출판물에서 이 코드를 재사용하는 것은 하우스 룰에 의해 관리됩니다. 님은 즐겨찾기로 이 스크립트를 차트에서 쓸 수 있습니다.
@FractalTrade_
면책사항
이 정보와 게시물은 TradingView에서 제공하거나 보증하는 금융, 투자, 거래 또는 기타 유형의 조언이나 권고 사항을 의미하거나 구성하지 않습니다. 자세한 내용은 이용 약관을 참고하세요.