INVITE-ONLY SCRIPT
Ranger
Indicator Ranger
Class: oscillator
Type of trading: intraday
Period: daily
Description
A lot of technical indicators are based on quite doubtful assumptions and unconfirmed patterns. One more typical drawback is absence of signals from indicators in form of absolute price values (this also concerns stop-loss and take-profit parameters). As the result it is hard to determine the exact entry and exit points for the trade. This is very important both for the beginners and experienced traders.
Developing Ranger we were trying to solve this problem and to create extremely simple and at the same scientifically based indicator.
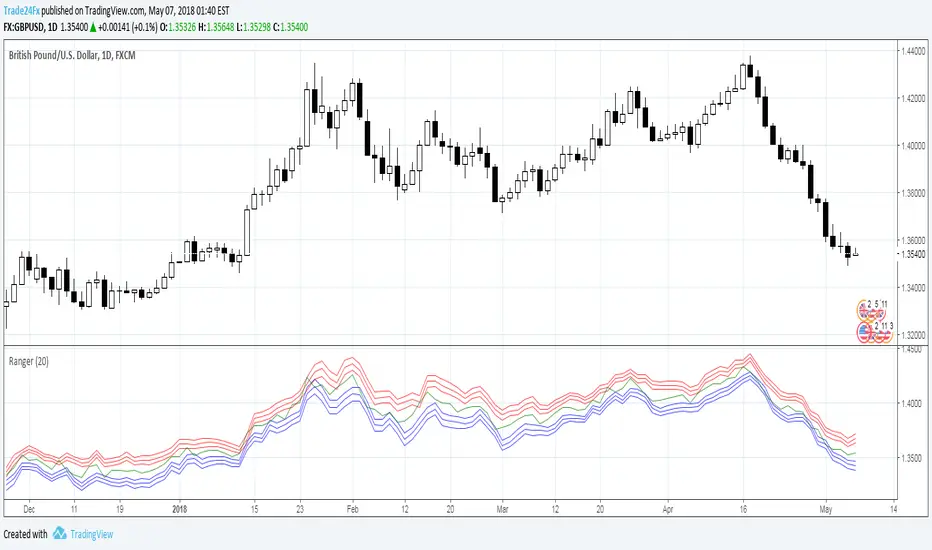
Ranger is based on statistical analysis of the data and provides information about possible maximum/minimum values of the day (just right after the day has started) with certain probabilities. So called synthetic support and resistance levels.
For example at 00:00 am EURUSD open price is 1.1350 Ranger will generate a number of price values which will indicate possible minimum/maximum of the day. It can be something like 1.1440 (high of the day with probability 75%) and 1.1260 (low of the day with probability 75%). Current version of the indicator can generate up to 3 high/low values with probabilities 70%, 95% and 99%. By probability we mean chance that the price will not go above/below generated high/low value.
What does this information give to the trader? Actually, a lot. First of all, trading signals. For example, if during a day the price approaches the upper (lower) mark, it can be concluded that it will not go higher (lower) prescribed mark today with already known probability. So, you can open a position opposite to the current movement, knowing in advance that it will be profitable with certain probability. For the full information about signals from Ranger see the “Trading signals” section.
Structure of the Indicator Ranger
1. Three blue lines – synthetic support lines. They describe 3 different buy zones with certain probabilities of success:
- First blue line (Buy zone #1) - the price today will not fall below this mark with a probability of 68%;
- Second blue line (Buy zone #2)- the price today will not fall below this mark with a probability of 95%;
- Third blue line (Buy zone #3) - the price today will not fall below this mark with a probability of 99%.
2. Three red lines – synthetic resistance lines. They describe 3 different sell zones with certain probabilities of success:
- First red line (Sell zone #1) - the price today will not rise above this mark with a probability of 68%;
- Second red line (Sell zone #2) - the price today will not rise above this mark with a probability of 95%;
- Third red line (Sell zone #3) - the price today will not rise above this mark with a probability of 99%.
3. Green line – shows current price. When it gets close to the red/blue line sell/buy signals are generated.
Trading rules
General rules are as follows: buy at the blue lines, sell at the red lines.
Take-profits for sells are set at the nearest blue line, for buys – at the nearest red line. Stop-losses for sells are set above the last red line, for buys – below the last blue line.
Class: oscillator
Type of trading: intraday
Period: daily
Description
A lot of technical indicators are based on quite doubtful assumptions and unconfirmed patterns. One more typical drawback is absence of signals from indicators in form of absolute price values (this also concerns stop-loss and take-profit parameters). As the result it is hard to determine the exact entry and exit points for the trade. This is very important both for the beginners and experienced traders.
Developing Ranger we were trying to solve this problem and to create extremely simple and at the same scientifically based indicator.
Ranger is based on statistical analysis of the data and provides information about possible maximum/minimum values of the day (just right after the day has started) with certain probabilities. So called synthetic support and resistance levels.
For example at 00:00 am EURUSD open price is 1.1350 Ranger will generate a number of price values which will indicate possible minimum/maximum of the day. It can be something like 1.1440 (high of the day with probability 75%) and 1.1260 (low of the day with probability 75%). Current version of the indicator can generate up to 3 high/low values with probabilities 70%, 95% and 99%. By probability we mean chance that the price will not go above/below generated high/low value.
What does this information give to the trader? Actually, a lot. First of all, trading signals. For example, if during a day the price approaches the upper (lower) mark, it can be concluded that it will not go higher (lower) prescribed mark today with already known probability. So, you can open a position opposite to the current movement, knowing in advance that it will be profitable with certain probability. For the full information about signals from Ranger see the “Trading signals” section.
Structure of the Indicator Ranger
1. Three blue lines – synthetic support lines. They describe 3 different buy zones with certain probabilities of success:
- First blue line (Buy zone #1) - the price today will not fall below this mark with a probability of 68%;
- Second blue line (Buy zone #2)- the price today will not fall below this mark with a probability of 95%;
- Third blue line (Buy zone #3) - the price today will not fall below this mark with a probability of 99%.
2. Three red lines – synthetic resistance lines. They describe 3 different sell zones with certain probabilities of success:
- First red line (Sell zone #1) - the price today will not rise above this mark with a probability of 68%;
- Second red line (Sell zone #2) - the price today will not rise above this mark with a probability of 95%;
- Third red line (Sell zone #3) - the price today will not rise above this mark with a probability of 99%.
3. Green line – shows current price. When it gets close to the red/blue line sell/buy signals are generated.
Trading rules
General rules are as follows: buy at the blue lines, sell at the red lines.
Take-profits for sells are set at the nearest blue line, for buys – at the nearest red line. Stop-losses for sells are set above the last red line, for buys – below the last blue line.
초대 전용 스크립트
이 스크립트는 작성자가 승인한 사용자만 접근할 수 있습니다. 사용하려면 요청 후 승인을 받아야 하며, 일반적으로 결제 후에 허가가 부여됩니다. 자세한 내용은 아래 작성자의 안내를 따르거나 Trade24Fx에게 직접 문의하세요.
트레이딩뷰는 스크립트의 작동 방식을 충분히 이해하고 작성자를 완전히 신뢰하지 않는 이상, 해당 스크립트에 비용을 지불하거나 사용하는 것을 권장하지 않습니다. 커뮤니티 스크립트에서 무료 오픈소스 대안을 찾아보실 수도 있습니다.
작성자 지시 사항
Авторские индикаторы
bit.ly/2oBvkHY
Больше информации на нашем ютьюб-канале
youtube.com/channel/UCYEOurJfasXWyYnrriGwsqQ
bit.ly/2oBvkHY
Больше информации на нашем ютьюб-канале
youtube.com/channel/UCYEOurJfasXWyYnrriGwsqQ
면책사항
해당 정보와 게시물은 금융, 투자, 트레이딩 또는 기타 유형의 조언이나 권장 사항으로 간주되지 않으며, 트레이딩뷰에서 제공하거나 보증하는 것이 아닙니다. 자세한 내용은 이용 약관을 참조하세요.