OPEN-SOURCE SCRIPT
Midnight and 7:30 AM Open with Reset
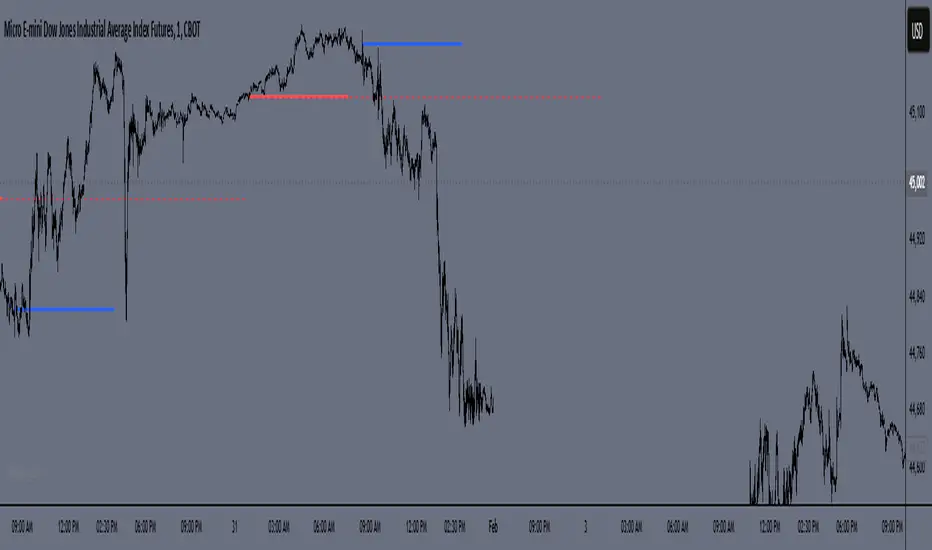
Extreme Discount and Extreme Premium Indicator
This custom indicator identifies the relationship between the current price and key discount and premium levels on the chart. It helps determine whether the price is in an "extreme discount" or "extreme premium" zone, which can be important for making trading decisions based on market structure.
Extreme Discount Zone: The indicator identifies the "extreme discount" zone when the price is below both its extreme discount levels, indicating that the market is in a potential buying area, which could signal a reversal or a good entry point to buy.
Extreme Premium Zone: The indicator marks the "extreme premium" zone when the price is above both its extreme premium levels, suggesting that the market is in a potential selling area, signaling a possible price reversal or a good entry point to sell.
The indicator dynamically adjusts and highlights these zones based on price movement, allowing traders to visualize when the price is reaching extreme levels relative to historical price action.
Key Features:
Detects when the current price is below both extreme discount levels.
Detects when the current price is above both extreme premium levels.
Highlights these extreme areas visually to help traders make informed decisions on buying or selling.
오픈 소스 스크립트
트레이딩뷰의 진정한 정신에 따라, 이 스크립트의 작성자는 이를 오픈소스로 공개하여 트레이더들이 기능을 검토하고 검증할 수 있도록 했습니다. 작성자에게 찬사를 보냅니다! 이 코드는 무료로 사용할 수 있지만, 코드를 재게시하는 경우 하우스 룰이 적용된다는 점을 기억하세요.
면책사항
해당 정보와 게시물은 금융, 투자, 트레이딩 또는 기타 유형의 조언이나 권장 사항으로 간주되지 않으며, 트레이딩뷰에서 제공하거나 보증하는 것이 아닙니다. 자세한 내용은 이용 약관을 참조하세요.
오픈 소스 스크립트
트레이딩뷰의 진정한 정신에 따라, 이 스크립트의 작성자는 이를 오픈소스로 공개하여 트레이더들이 기능을 검토하고 검증할 수 있도록 했습니다. 작성자에게 찬사를 보냅니다! 이 코드는 무료로 사용할 수 있지만, 코드를 재게시하는 경우 하우스 룰이 적용된다는 점을 기억하세요.
면책사항
해당 정보와 게시물은 금융, 투자, 트레이딩 또는 기타 유형의 조언이나 권장 사항으로 간주되지 않으며, 트레이딩뷰에서 제공하거나 보증하는 것이 아닙니다. 자세한 내용은 이용 약관을 참조하세요.