PROTECTED SOURCE SCRIPT
Trend Strength by Atilla Yurtseven
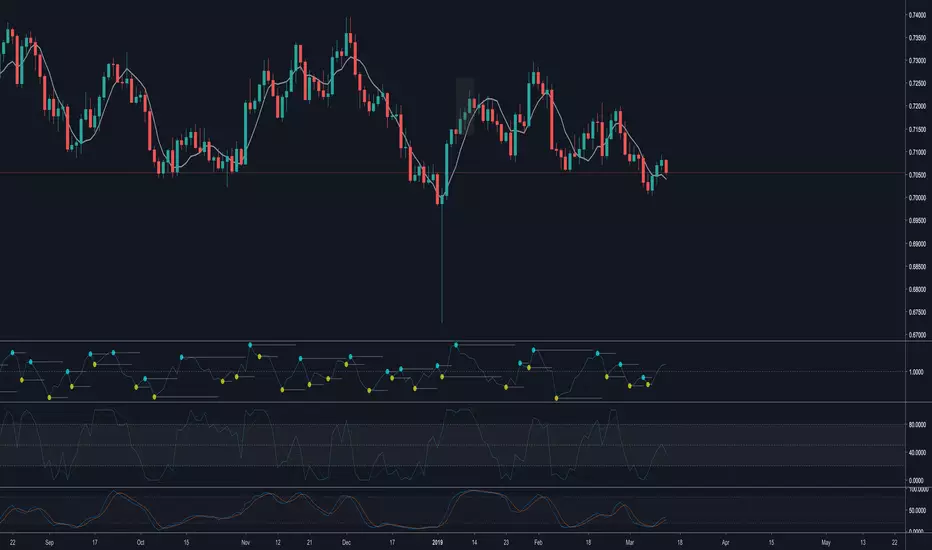
This is the indicator that I have developed to analyse the trends. You can choose your favorite trend indicators from the list. I mostly use Linear. You can enable oscillator mode as well.
What does this indicator tell me?
This indicator simply shows you prices in a horizontal space. Assuming you are using simple moving average. Calculation is "price - moving_average_value" (or "price / moving_average_value in Rate mode). Once you do this, you see the prices move around above or below the base line. By using this indicator, you can find out how far you are from your moving average. If the price is lower than base line and it's very far away from it, this means that price is cheap and vice versa.
IMPORTANT:
Lots of traders use such indicators in a wrong way and lots of trainers teach this strategy wrong way. They always tell you to buy once the price cross over a moving average. I would never buy something if it is above the moving average. I'll just let it go. Or I will never short sell below MA which means it's already cheap and i would look for buying opportunity only.
DISCLAIMER:
This is not financial advice.
Follow me to get notified when i publish new indicators, educational posts or trading signals.
Trade safe,
Atilla Yurtseven
보호된 스크립트입니다
이 스크립트는 비공개 소스로 게시됩니다. 하지만 이를 자유롭게 제한 없이 사용할 수 있습니다 – 자세한 내용은 여기에서 확인하세요.
I know Kung-Fu!
면책사항
해당 정보와 게시물은 금융, 투자, 트레이딩 또는 기타 유형의 조언이나 권장 사항으로 간주되지 않으며, 트레이딩뷰에서 제공하거나 보증하는 것이 아닙니다. 자세한 내용은 이용 약관을 참조하세요.
보호된 스크립트입니다
이 스크립트는 비공개 소스로 게시됩니다. 하지만 이를 자유롭게 제한 없이 사용할 수 있습니다 – 자세한 내용은 여기에서 확인하세요.
I know Kung-Fu!
면책사항
해당 정보와 게시물은 금융, 투자, 트레이딩 또는 기타 유형의 조언이나 권장 사항으로 간주되지 않으며, 트레이딩뷰에서 제공하거나 보증하는 것이 아닙니다. 자세한 내용은 이용 약관을 참조하세요.