OPEN-SOURCE SCRIPT
업데이트됨 Kaufman Efficiency Ratio-Based Risk Percentage
OVERVIEW
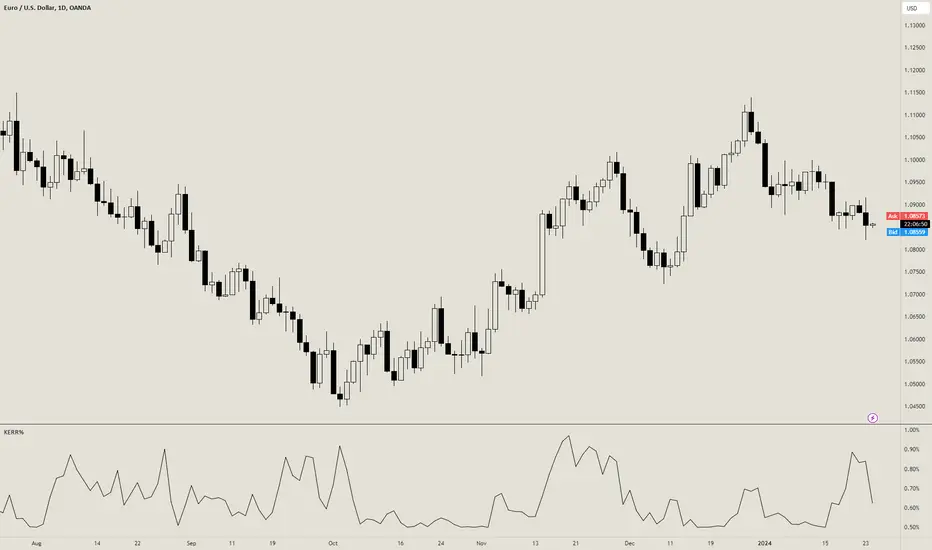
The Kaufman Efficiency Ratio-Based Exposure Management indicator uses the Kaufman Efficiency Ratio (KER) to calculate how much you should risk per trade.
If KER is high, then the indicator will tell you to risk more per trade.
If KER is low, then the indicator will tell you to risk less per trade.
CONCEPTS
The Kaufman Efficiency Ratio (also known as the Efficiency Ratio, KER, or ER) is a separate indicator developed by Perry J. Kaufman and first published in Kaufman's book, "New Trading Systems and Methods" in 1987.
The KER used to measure the efficiency of a financial instrument's price movement. It is calculated as follows:
KER = (change in price over x bars) / (sum of absolute price changes over x bars)
The first part of the formula, "change in price over x bars" measures the difference between the current close price and the close price x bars ago. The second part of the formula "sum of absolute price changes over x bars" measures the sum of the |open-close| range of each bar between now and x bars ago.
If there is a high change in price over x bars relative to the sum of absolute price changes over x bars, a trending/volatile market is likely in place.
If there is a low change in price over x bars relative to the sum of absolute price changes over x bars, a ranging/choppy market is likely in place.
If you are a trend trader, you can assume that entries taken during high KER periods are more likely to lead to a trend. This indicator helps capitalize on that assumption by increasing risk % per trade during high KER periods, and decreasing risk % per trade during low KER periods.
It uses the following formulas to calculate a KER-adjusted risk % per trade:
min risk = the smallest amount you'd be willing to risk on a trade
max risk = the largest amount you'd be willing to risk on a trade
KER = the current Kaufman Efficiency Ratio value
n = an exponent factor used to control the rate of increase of the risk %
Here is an example of how these formulas work:
Assuming that min risk is 0.5%, max risk is 2%, and KER is 0.8 (indicating a trending market), we can calculate the following risk per trade amounts:
Now, lets do the same calculations with a lower KER of 0.2, which indicates a choppy market:
With a high KER, we risk more per trade to capitalize on the higher chance of a trending market. With a lower KER, we risk less per trade to protect ourselves from the higher chance of a choppy market.
The Kaufman Efficiency Ratio-Based Exposure Management indicator uses the Kaufman Efficiency Ratio (KER) to calculate how much you should risk per trade.
If KER is high, then the indicator will tell you to risk more per trade.
- A high KER value indicates a trending market, so if you are a trend trader, it makes sense to risk more during these times.
If KER is low, then the indicator will tell you to risk less per trade.
- A low KER value indicates a trending market, so if you are a trend trader, it makes sense to risk less during these times.
CONCEPTS
The Kaufman Efficiency Ratio (also known as the Efficiency Ratio, KER, or ER) is a separate indicator developed by Perry J. Kaufman and first published in Kaufman's book, "New Trading Systems and Methods" in 1987.
The KER used to measure the efficiency of a financial instrument's price movement. It is calculated as follows:
KER = (change in price over x bars) / (sum of absolute price changes over x bars)
The first part of the formula, "change in price over x bars" measures the difference between the current close price and the close price x bars ago. The second part of the formula "sum of absolute price changes over x bars" measures the sum of the |open-close| range of each bar between now and x bars ago.
If there is a high change in price over x bars relative to the sum of absolute price changes over x bars, a trending/volatile market is likely in place.
If there is a low change in price over x bars relative to the sum of absolute price changes over x bars, a ranging/choppy market is likely in place.
If you are a trend trader, you can assume that entries taken during high KER periods are more likely to lead to a trend. This indicator helps capitalize on that assumption by increasing risk % per trade during high KER periods, and decreasing risk % per trade during low KER periods.
It uses the following formulas to calculate a KER-adjusted risk % per trade:
- Linearly-increasing risk % = min risk + (KER * (max risk - min risk))
- Exponentially-increasing risk % = min risk + ((KER^n) * (max risk - min risk))
min risk = the smallest amount you'd be willing to risk on a trade
max risk = the largest amount you'd be willing to risk on a trade
KER = the current Kaufman Efficiency Ratio value
n = an exponent factor used to control the rate of increase of the risk %
Here is an example of how these formulas work:
Assuming that min risk is 0.5%, max risk is 2%, and KER is 0.8 (indicating a trending market), we can calculate the following risk per trade amounts:
- Linearly-increasing risk % = 0.5 + (0.8 * (2 - 0.5)) = 1.7%
- Exponentially-increasing risk % = 0.5 + ((0.8^3) * (2 - 0.5)) = 1.27%
Now, lets do the same calculations with a lower KER of 0.2, which indicates a choppy market:
- Linearly-increasing risk % = 0.5 + (0.2 * (2 - 0.5)) = 0.8%
- Exponentially-increasing risk % = 0.5 + ((0.2^3) * (2 - 0.5)) = 0.51%
With a high KER, we risk more per trade to capitalize on the higher chance of a trending market. With a lower KER, we risk less per trade to protect ourselves from the higher chance of a choppy market.
릴리즈 노트
Minor cosmetic changes in input settings릴리즈 노트
Added option to invert the indicator's calculation.오픈 소스 스크립트
트레이딩뷰의 진정한 정신에 따라, 이 스크립트의 작성자는 이를 오픈소스로 공개하여 트레이더들이 기능을 검토하고 검증할 수 있도록 했습니다. 작성자에게 찬사를 보냅니다! 이 코드는 무료로 사용할 수 있지만, 코드를 재게시하는 경우 하우스 룰이 적용된다는 점을 기억하세요.
면책사항
해당 정보와 게시물은 금융, 투자, 트레이딩 또는 기타 유형의 조언이나 권장 사항으로 간주되지 않으며, 트레이딩뷰에서 제공하거나 보증하는 것이 아닙니다. 자세한 내용은 이용 약관을 참조하세요.
오픈 소스 스크립트
트레이딩뷰의 진정한 정신에 따라, 이 스크립트의 작성자는 이를 오픈소스로 공개하여 트레이더들이 기능을 검토하고 검증할 수 있도록 했습니다. 작성자에게 찬사를 보냅니다! 이 코드는 무료로 사용할 수 있지만, 코드를 재게시하는 경우 하우스 룰이 적용된다는 점을 기억하세요.
면책사항
해당 정보와 게시물은 금융, 투자, 트레이딩 또는 기타 유형의 조언이나 권장 사항으로 간주되지 않으며, 트레이딩뷰에서 제공하거나 보증하는 것이 아닙니다. 자세한 내용은 이용 약관을 참조하세요.