INVITE-ONLY SCRIPT
Quarterly Financials on Chart with Estimates by SpeedEdge)
# Quarterly Financials on Chart with Estimates
## WHAT THIS SCRIPT DOES
This indicator displays comprehensive quarterly financial data directly on your trading chart, eliminating the need to switch between charting and fundamental analysis platforms. The script automatically fetches and organizes key financial metrics including earnings per share (EPS), revenue, operating margins, depreciation & amortization, and quarterly estimates alongside actual results for comparative analysis.
## WHY THIS COMBINATION IS ORIGINAL AND USEFUL
**The Problem Solved:** Traders conducting fundamental analysis typically need to toggle between trading charts and separate financial platforms to view quarterly results, estimates, and year-over-year comparisons. This workflow is inefficient and makes it difficult to correlate price movements with earnings announcements.
**The Solution:** This script integrates fundamental financial data directly into the price chart environment, providing:
- Side-by-side comparison of quarterly estimates versus actual results
- Automatic calculation of Quarter-over-Quarter (QoQ) and Year-over-Year (YoY) growth rates
- Color-coded visualization of financial performance trends
- Regional number formatting (Indian Crores or Global Billions/Millions)
- Key valuation metrics (Market Cap, Free Float, PEG Ratio, CFO/EBITDA) in header
**Unique Features:**
1. **Dual Number Format System**: Automatically formats financial figures in Indian Crores (Cr, K Cr, L Cr) or Global formats (M, B, T) based on user preference
2. **Estimate Integration**: Shows analyst estimates for upcoming quarters alongside historical actuals for beat/miss analysis
3. **Intelligent Growth Analysis**: Automatically calculates and color-codes quarterly and yearly growth comparisons with smart handling of missing data
4. **Context-Aware Color Coding**: Green/red visualization adapts based on metric type - growth metrics, cash flow quality indicators, and expense trends each use appropriate color logic
5. **Configurable History**: Display 4 to 20 previous quarters based on analysis needs
## HOW THE SCRIPT WORKS TECHNICALLY
### Core Methodology:
**1. Financial Data Integration:**
The script accesses quarterly and annual financial statement data from public company filings, including:
- **Earnings Estimates**: Analyst consensus forecasts for upcoming quarters
- **Quarterly Actuals**: Reported earnings per share, revenue, margins, and operating expenses
- **Key Ratios**: Shares outstanding data, valuation multiples, and cash flow metrics
All data is sourced from TradingView's fundamental database, which aggregates information from official regulatory filings (10-Q, 10-K, annual reports) filed by publicly traded companies.
**2. Historical Data Organization:**
The script employs a sophisticated data structure system that:
- Detects when new quarterly results are released by monitoring data changes
- Automatically indexes financial data by quarters relative to the current date
- Creates a chronological timeline of financial performance
- Maintains historical records for comparison calculations
- Updates dynamically as new earnings are reported
**3. Intelligent Number Formatting:**
**Indian Regional Format:**
- Converts absolute values to Crore denomination (1 Crore = 10 Million)
- Scales to Thousand Crores (K Cr) for mid-size companies
- Scales to Lakh Crores (L Cr) for large corporations
- Appropriate for analyzing Indian market stocks
**Global Standard Format:**
- Uses Million (M) for smaller companies
- Scales to Billion (B) for mid-cap and large-cap stocks
- Uses Trillion (T) for mega-cap corporations
- Thousands (K) for smaller financial figures
- Standard across US and international markets
**4. Comparative Growth Analysis:**
**Quarter-over-Quarter (QoQ) Calculations:**
The script compares each quarter's performance against the immediately preceding quarter to identify:
- Sequential growth trends
- Momentum acceleration or deceleration
- Short-term business trajectory
- Seasonal pattern changes
**Year-over-Year (YoY) Calculations:**
Compares each quarter against the same quarter from the previous year to:
- Eliminate seasonal effects
- Identify sustainable growth trends
- Normalize for business cycles
- Provide apples-to-apples comparison
Both calculations automatically handle edge cases like missing data, account for different fiscal year conventions, and provide meaningful "N/A" indicators when comparative data is unavailable.
**5. Adaptive Color Coding System:**
**Growth Metrics (EPS, Revenue):**
- Positive growth → Green shading indicates improving performance
- Negative growth → Red shading signals declining performance
- Missing data → Gray indicates insufficient information
**Quality Indicators (Free Float %):**
- Lower float (<40%) → Green indicates potentially better supply-demand dynamics
- Higher float (≥40%) → Red suggests more diluted ownership
**Cash Flow Quality (CFO/EBITDA):**
- Strong cash conversion (≥50%) → Green shows quality earnings
- Weak cash conversion (<50%) → Red flags potential accounting concerns
**Expense Trends (Depreciation & Amortization):**
- Decreasing D&A → Green indicates improving cash flow characteristics
- Increasing D&A → Red suggests rising capital intensity
- Stable D&A → Default color shows consistency
**Future Estimates:**
- Yellow coloring clearly distinguishes forward-looking estimates from historical actuals
**6. Date and Quarter Intelligence:**
The script automatically:
- Determines the current financial quarter based on real-time date
- Maps calendar months to fiscal quarters (Q1-Q4)
- Handles different fiscal year conventions globally
- Calculates quarter differentials for accurate historical lookback
- Formats display labels showing quarter-end months and years (e.g., "Mar 24", "Dec 23")
### Advanced Calculations:
**Free Float Percentage:**
Calculates the proportion of shares available for public trading relative to total shares outstanding. Lower percentages indicate more concentrated ownership, which can affect volatility and liquidity.
**Market Capitalization:**
Real-time calculation using total shares outstanding multiplied by current market price, automatically updated with each price tick and formatted according to regional preferences.
**CFO/EBITDA Cash Quality Ratio:**
Measures what percentage of accounting earnings converts to actual operating cash flow. Higher ratios indicate better earnings quality and less aggressive accounting. Industry standards vary, but 60-100% typically signals strong cash generation.
**Operating Profit Margin Tracking:**
Monitors the percentage of revenue retained as operating profit after deducting operating expenses, providing insight into operational efficiency and pricing power trends.
## HOW TO USE THIS SCRIPT
### Initial Setup:
**1. Region Configuration:**
- **India**: Select for Indian stocks - formats numbers in Crores (₹10M = 1 Cr)
- **Global**: Select for international stocks - formats in Millions/Billions
**2. Display Settings:**
- **Position**: Choose table location on chart (Top Right recommended)
- **Table Size**: Adjust based on screen resolution (Normal is default)
- **Short Labels**: Enable to condense industry/sector names for space saving
- **Lookback Quarters**: Set how many previous quarters to display (4-20, default 5)
**3. Visual Customization:**
- **Background Color**: Customize table background color and transparency
- **Text Color**: Adjust text color for visibility
- **Border/Frame Colors**: Modify table borders for preferred appearance
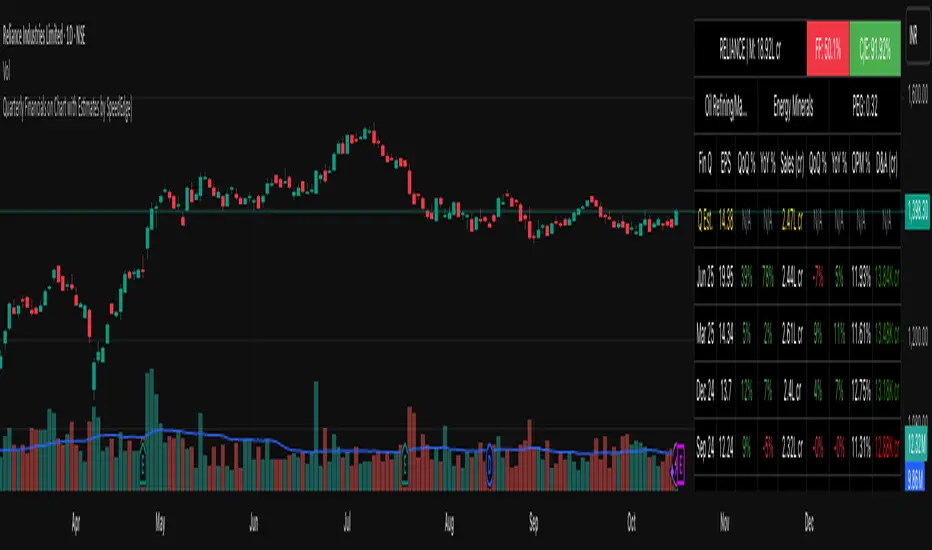
### Reading the Dashboard:
**Header Section (Top 3 Rows):**
**Row 1:**
- **Ticker | Mcap**: Company symbol and current market capitalization
- **FF (Free Float)**: Percentage of freely traded shares (Green < 40% is positive, Red ≥ 40%)
- **CFO/EBITDA**: Cash flow quality ratio (Green ≥ 50% is positive, Red < 50%)
**Row 2:**
- **Industry**: Company's specific industry classification
- **Sector**: Broader sector classification
- **PEG Ratio**: Price/Earnings to Growth ratio (< 1 traditionally considered undervalued)
**Data Section:**
**Column Explanations:**
1. **Fin Q**: Financial quarter (format: "Mar 24" = Q4 FY2024 ending March)
2. **EPS**: Earnings Per Share in reporting currency
3. **QoQ %**: EPS growth versus previous quarter (Green = increase, Red = decrease)
4. **YoY %**: EPS growth versus same quarter last year
5. **Sales**: Total revenue (formatted in Cr or M/B based on region)
6. **QoQ %**: Revenue growth versus previous quarter
7. **YoY %**: Revenue growth versus same quarter last year
8. **OPM %**: Operating Profit Margin percentage
9. **D&A**: Depreciation & Amortization (Green if decreasing = cash flow positive)
**Estimates Row (Yellow Text):**
- Shows "Q Est." for upcoming quarter
- Displays analyst consensus estimates for EPS and Sales
- Compare actuals against estimates after earnings release to identify beats/misses
### Trading Applications:
**Fundamental Analysis:**
- **Earnings Quality Check**: Look for consistent QoQ and YoY growth in both EPS and Sales
- **Margin Trend Analysis**: Monitor OPM % changes to assess operational efficiency
- **Estimate Comparison**: Identify stocks that consistently beat or miss estimates
- **Cash Flow Validation**: Use CFO/EBITDA ratio to verify earnings quality
**Entry/Exit Timing:**
- **Post-Earnings Analysis**: Check if stock beat estimates and by what margin
- **Trend Confirmation**: Strong YoY growth + improving margins = positive fundamentals
- **Warning Signs**: Declining margins, negative growth, or deteriorating CFO/EBITDA
**Portfolio Screening:**
- **Growth Stocks**: Look for consistent QoQ and YoY EPS/Sales growth
- **Value Stocks**: Low PEG ratios combined with positive fundamentals
- **Quality Filter**: High CFO/EBITDA ratios (>75%) indicate superior cash generation
### Interpretation Guidelines:
**Strong Fundamental Setup:**
- YoY growth > 15% in both EPS and Sales
- QoQ growth positive for 2+ consecutive quarters
- OPM % stable or improving
- CFO/EBITDA > 60%
- Actual results exceed estimates
**Concerning Signals:**
- Declining YoY growth rates
- Shrinking operating margins
- Consistently missing estimates
- CFO/EBITDA < 40%
- Increasing D&A as percentage of revenue
## IMPORTANT USAGE NOTES
**Data Limitations:**
- Financial data depends on official company filings and reporting schedules
- Some stocks may have incomplete historical data depending on listing history
- Estimates may not be available for all companies, especially smaller-cap stocks
- Data updates occur after official earnings releases, not in real-time during announcements
**Realistic Expectations:**
- This tool displays historical fundamental data for analysis - not predictive signals
- Always verify critical financial data with official company filings when making investment decisions
- Fundamental analysis should complement technical analysis, not replace it
- Past financial performance does not guarantee future results
- Earnings estimates are analyst opinions, not certainties
**Best Practices:**
- Cross-reference important data points with company investor relations pages
- Consider industry-specific metrics beyond the displayed general figures
- Use in conjunction with technical indicators for comprehensive analysis
- Monitor for data anomalies (stock splits, accounting changes, restatements) that may affect comparisons
- Understand that different accounting standards (GAAP vs IFRS) may affect international comparisons
**Regional Considerations:**
- Indian stocks: Numbers in Crores (1 Cr = 10 Million Rupees)
- Global stocks: Numbers in standard M/B/T format
- Currency conversions are not performed - data shown in reporting currency
- Fiscal year conventions vary by region (India typically uses Apr-Mar fiscal year, US uses Jan-Dec or custom fiscal years)
- Different markets have different reporting timelines and requirements
## CONFIGURATION RECOMMENDATIONS
**For Indian Stocks:**
- Region: India
- Lookback: 5-8 quarters (recommended)
- Focus on YoY growth due to seasonal business patterns in many Indian companies
**For US/Global Stocks:**
- Region: Global
- Lookback: 4-6 quarters for tech/growth stocks
- Lookback: 8-12 quarters for cyclical/industrial stocks
- Monitor QoQ trends closely for rapid-growth sectors
**For Long-term Investors:**
- Increase lookback to 12-20 quarters to see multi-year trends
- Focus on consistency rather than individual quarter volatility
- Pay close attention to CFO/EBITDA quality metric for sustainable businesses
- Look for stable or improving margins over extended periods
**For Active Traders:**
- Use 4-6 quarter lookback for recent trend focus
- Concentrate on latest QoQ trends and estimate beats/misses
- Monitor table closely before/after earnings announcements
- Compare estimate versus actual immediately post-earnings for trading opportunities
**For Swing Traders:**
- 6-8 quarter lookback provides good balance
- Focus on acceleration/deceleration in growth rates
- Use margin trends to identify operational inflection points
- Combine with technical analysis for optimal entry/exit timing
This script serves as a comprehensive fundamental analysis tool for traders and investors who want seamless chart integration of financial data without workflow interruption, enabling faster and more informed decision-making.
## WHAT THIS SCRIPT DOES
This indicator displays comprehensive quarterly financial data directly on your trading chart, eliminating the need to switch between charting and fundamental analysis platforms. The script automatically fetches and organizes key financial metrics including earnings per share (EPS), revenue, operating margins, depreciation & amortization, and quarterly estimates alongside actual results for comparative analysis.
## WHY THIS COMBINATION IS ORIGINAL AND USEFUL
**The Problem Solved:** Traders conducting fundamental analysis typically need to toggle between trading charts and separate financial platforms to view quarterly results, estimates, and year-over-year comparisons. This workflow is inefficient and makes it difficult to correlate price movements with earnings announcements.
**The Solution:** This script integrates fundamental financial data directly into the price chart environment, providing:
- Side-by-side comparison of quarterly estimates versus actual results
- Automatic calculation of Quarter-over-Quarter (QoQ) and Year-over-Year (YoY) growth rates
- Color-coded visualization of financial performance trends
- Regional number formatting (Indian Crores or Global Billions/Millions)
- Key valuation metrics (Market Cap, Free Float, PEG Ratio, CFO/EBITDA) in header
**Unique Features:**
1. **Dual Number Format System**: Automatically formats financial figures in Indian Crores (Cr, K Cr, L Cr) or Global formats (M, B, T) based on user preference
2. **Estimate Integration**: Shows analyst estimates for upcoming quarters alongside historical actuals for beat/miss analysis
3. **Intelligent Growth Analysis**: Automatically calculates and color-codes quarterly and yearly growth comparisons with smart handling of missing data
4. **Context-Aware Color Coding**: Green/red visualization adapts based on metric type - growth metrics, cash flow quality indicators, and expense trends each use appropriate color logic
5. **Configurable History**: Display 4 to 20 previous quarters based on analysis needs
## HOW THE SCRIPT WORKS TECHNICALLY
### Core Methodology:
**1. Financial Data Integration:**
The script accesses quarterly and annual financial statement data from public company filings, including:
- **Earnings Estimates**: Analyst consensus forecasts for upcoming quarters
- **Quarterly Actuals**: Reported earnings per share, revenue, margins, and operating expenses
- **Key Ratios**: Shares outstanding data, valuation multiples, and cash flow metrics
All data is sourced from TradingView's fundamental database, which aggregates information from official regulatory filings (10-Q, 10-K, annual reports) filed by publicly traded companies.
**2. Historical Data Organization:**
The script employs a sophisticated data structure system that:
- Detects when new quarterly results are released by monitoring data changes
- Automatically indexes financial data by quarters relative to the current date
- Creates a chronological timeline of financial performance
- Maintains historical records for comparison calculations
- Updates dynamically as new earnings are reported
**3. Intelligent Number Formatting:**
**Indian Regional Format:**
- Converts absolute values to Crore denomination (1 Crore = 10 Million)
- Scales to Thousand Crores (K Cr) for mid-size companies
- Scales to Lakh Crores (L Cr) for large corporations
- Appropriate for analyzing Indian market stocks
**Global Standard Format:**
- Uses Million (M) for smaller companies
- Scales to Billion (B) for mid-cap and large-cap stocks
- Uses Trillion (T) for mega-cap corporations
- Thousands (K) for smaller financial figures
- Standard across US and international markets
**4. Comparative Growth Analysis:**
**Quarter-over-Quarter (QoQ) Calculations:**
The script compares each quarter's performance against the immediately preceding quarter to identify:
- Sequential growth trends
- Momentum acceleration or deceleration
- Short-term business trajectory
- Seasonal pattern changes
**Year-over-Year (YoY) Calculations:**
Compares each quarter against the same quarter from the previous year to:
- Eliminate seasonal effects
- Identify sustainable growth trends
- Normalize for business cycles
- Provide apples-to-apples comparison
Both calculations automatically handle edge cases like missing data, account for different fiscal year conventions, and provide meaningful "N/A" indicators when comparative data is unavailable.
**5. Adaptive Color Coding System:**
**Growth Metrics (EPS, Revenue):**
- Positive growth → Green shading indicates improving performance
- Negative growth → Red shading signals declining performance
- Missing data → Gray indicates insufficient information
**Quality Indicators (Free Float %):**
- Lower float (<40%) → Green indicates potentially better supply-demand dynamics
- Higher float (≥40%) → Red suggests more diluted ownership
**Cash Flow Quality (CFO/EBITDA):**
- Strong cash conversion (≥50%) → Green shows quality earnings
- Weak cash conversion (<50%) → Red flags potential accounting concerns
**Expense Trends (Depreciation & Amortization):**
- Decreasing D&A → Green indicates improving cash flow characteristics
- Increasing D&A → Red suggests rising capital intensity
- Stable D&A → Default color shows consistency
**Future Estimates:**
- Yellow coloring clearly distinguishes forward-looking estimates from historical actuals
**6. Date and Quarter Intelligence:**
The script automatically:
- Determines the current financial quarter based on real-time date
- Maps calendar months to fiscal quarters (Q1-Q4)
- Handles different fiscal year conventions globally
- Calculates quarter differentials for accurate historical lookback
- Formats display labels showing quarter-end months and years (e.g., "Mar 24", "Dec 23")
### Advanced Calculations:
**Free Float Percentage:**
Calculates the proportion of shares available for public trading relative to total shares outstanding. Lower percentages indicate more concentrated ownership, which can affect volatility and liquidity.
**Market Capitalization:**
Real-time calculation using total shares outstanding multiplied by current market price, automatically updated with each price tick and formatted according to regional preferences.
**CFO/EBITDA Cash Quality Ratio:**
Measures what percentage of accounting earnings converts to actual operating cash flow. Higher ratios indicate better earnings quality and less aggressive accounting. Industry standards vary, but 60-100% typically signals strong cash generation.
**Operating Profit Margin Tracking:**
Monitors the percentage of revenue retained as operating profit after deducting operating expenses, providing insight into operational efficiency and pricing power trends.
## HOW TO USE THIS SCRIPT
### Initial Setup:
**1. Region Configuration:**
- **India**: Select for Indian stocks - formats numbers in Crores (₹10M = 1 Cr)
- **Global**: Select for international stocks - formats in Millions/Billions
**2. Display Settings:**
- **Position**: Choose table location on chart (Top Right recommended)
- **Table Size**: Adjust based on screen resolution (Normal is default)
- **Short Labels**: Enable to condense industry/sector names for space saving
- **Lookback Quarters**: Set how many previous quarters to display (4-20, default 5)
**3. Visual Customization:**
- **Background Color**: Customize table background color and transparency
- **Text Color**: Adjust text color for visibility
- **Border/Frame Colors**: Modify table borders for preferred appearance
### Reading the Dashboard:
**Header Section (Top 3 Rows):**
**Row 1:**
- **Ticker | Mcap**: Company symbol and current market capitalization
- **FF (Free Float)**: Percentage of freely traded shares (Green < 40% is positive, Red ≥ 40%)
- **CFO/EBITDA**: Cash flow quality ratio (Green ≥ 50% is positive, Red < 50%)
**Row 2:**
- **Industry**: Company's specific industry classification
- **Sector**: Broader sector classification
- **PEG Ratio**: Price/Earnings to Growth ratio (< 1 traditionally considered undervalued)
**Data Section:**
**Column Explanations:**
1. **Fin Q**: Financial quarter (format: "Mar 24" = Q4 FY2024 ending March)
2. **EPS**: Earnings Per Share in reporting currency
3. **QoQ %**: EPS growth versus previous quarter (Green = increase, Red = decrease)
4. **YoY %**: EPS growth versus same quarter last year
5. **Sales**: Total revenue (formatted in Cr or M/B based on region)
6. **QoQ %**: Revenue growth versus previous quarter
7. **YoY %**: Revenue growth versus same quarter last year
8. **OPM %**: Operating Profit Margin percentage
9. **D&A**: Depreciation & Amortization (Green if decreasing = cash flow positive)
**Estimates Row (Yellow Text):**
- Shows "Q Est." for upcoming quarter
- Displays analyst consensus estimates for EPS and Sales
- Compare actuals against estimates after earnings release to identify beats/misses
### Trading Applications:
**Fundamental Analysis:**
- **Earnings Quality Check**: Look for consistent QoQ and YoY growth in both EPS and Sales
- **Margin Trend Analysis**: Monitor OPM % changes to assess operational efficiency
- **Estimate Comparison**: Identify stocks that consistently beat or miss estimates
- **Cash Flow Validation**: Use CFO/EBITDA ratio to verify earnings quality
**Entry/Exit Timing:**
- **Post-Earnings Analysis**: Check if stock beat estimates and by what margin
- **Trend Confirmation**: Strong YoY growth + improving margins = positive fundamentals
- **Warning Signs**: Declining margins, negative growth, or deteriorating CFO/EBITDA
**Portfolio Screening:**
- **Growth Stocks**: Look for consistent QoQ and YoY EPS/Sales growth
- **Value Stocks**: Low PEG ratios combined with positive fundamentals
- **Quality Filter**: High CFO/EBITDA ratios (>75%) indicate superior cash generation
### Interpretation Guidelines:
**Strong Fundamental Setup:**
- YoY growth > 15% in both EPS and Sales
- QoQ growth positive for 2+ consecutive quarters
- OPM % stable or improving
- CFO/EBITDA > 60%
- Actual results exceed estimates
**Concerning Signals:**
- Declining YoY growth rates
- Shrinking operating margins
- Consistently missing estimates
- CFO/EBITDA < 40%
- Increasing D&A as percentage of revenue
## IMPORTANT USAGE NOTES
**Data Limitations:**
- Financial data depends on official company filings and reporting schedules
- Some stocks may have incomplete historical data depending on listing history
- Estimates may not be available for all companies, especially smaller-cap stocks
- Data updates occur after official earnings releases, not in real-time during announcements
**Realistic Expectations:**
- This tool displays historical fundamental data for analysis - not predictive signals
- Always verify critical financial data with official company filings when making investment decisions
- Fundamental analysis should complement technical analysis, not replace it
- Past financial performance does not guarantee future results
- Earnings estimates are analyst opinions, not certainties
**Best Practices:**
- Cross-reference important data points with company investor relations pages
- Consider industry-specific metrics beyond the displayed general figures
- Use in conjunction with technical indicators for comprehensive analysis
- Monitor for data anomalies (stock splits, accounting changes, restatements) that may affect comparisons
- Understand that different accounting standards (GAAP vs IFRS) may affect international comparisons
**Regional Considerations:**
- Indian stocks: Numbers in Crores (1 Cr = 10 Million Rupees)
- Global stocks: Numbers in standard M/B/T format
- Currency conversions are not performed - data shown in reporting currency
- Fiscal year conventions vary by region (India typically uses Apr-Mar fiscal year, US uses Jan-Dec or custom fiscal years)
- Different markets have different reporting timelines and requirements
## CONFIGURATION RECOMMENDATIONS
**For Indian Stocks:**
- Region: India
- Lookback: 5-8 quarters (recommended)
- Focus on YoY growth due to seasonal business patterns in many Indian companies
**For US/Global Stocks:**
- Region: Global
- Lookback: 4-6 quarters for tech/growth stocks
- Lookback: 8-12 quarters for cyclical/industrial stocks
- Monitor QoQ trends closely for rapid-growth sectors
**For Long-term Investors:**
- Increase lookback to 12-20 quarters to see multi-year trends
- Focus on consistency rather than individual quarter volatility
- Pay close attention to CFO/EBITDA quality metric for sustainable businesses
- Look for stable or improving margins over extended periods
**For Active Traders:**
- Use 4-6 quarter lookback for recent trend focus
- Concentrate on latest QoQ trends and estimate beats/misses
- Monitor table closely before/after earnings announcements
- Compare estimate versus actual immediately post-earnings for trading opportunities
**For Swing Traders:**
- 6-8 quarter lookback provides good balance
- Focus on acceleration/deceleration in growth rates
- Use margin trends to identify operational inflection points
- Combine with technical analysis for optimal entry/exit timing
This script serves as a comprehensive fundamental analysis tool for traders and investors who want seamless chart integration of financial data without workflow interruption, enabling faster and more informed decision-making.
초대 전용 스크립트
이 스크립트는 작성자가 승인한 사용자만 접근할 수 있습니다. 사용하려면 요청 후 승인을 받아야 하며, 일반적으로 결제 후에 허가가 부여됩니다. 자세한 내용은 아래 작성자의 안내를 따르거나 DeltaSpeedEdge에게 직접 문의하세요.
트레이딩뷰는 스크립트의 작동 방식을 충분히 이해하고 작성자를 완전히 신뢰하지 않는 이상, 해당 스크립트에 비용을 지불하거나 사용하는 것을 권장하지 않습니다. 커뮤니티 스크립트에서 무료 오픈소스 대안을 찾아보실 수도 있습니다.
작성자 지시 사항
To request access to this script, please send me a private message on TradingView describing your intended use case. Access will be granted on a case-by-case basis.
📊 DeltaSpeedEdge | Customised Pine Script Solutions
📈 MTF Dashboards • AI Signals • Algo Tools
📩 Telegram: t.me/DeltaSpeedEdge
📷 Instagram: instagram.com/DeltaSpeedEdge
▶️ YouTube: youtube.com/@DeltaSpeedEdge
📈 MTF Dashboards • AI Signals • Algo Tools
📩 Telegram: t.me/DeltaSpeedEdge
📷 Instagram: instagram.com/DeltaSpeedEdge
▶️ YouTube: youtube.com/@DeltaSpeedEdge
면책사항
해당 정보와 게시물은 금융, 투자, 트레이딩 또는 기타 유형의 조언이나 권장 사항으로 간주되지 않으며, 트레이딩뷰에서 제공하거나 보증하는 것이 아닙니다. 자세한 내용은 이용 약관을 참조하세요.