INVITE-ONLY SCRIPT
업데이트됨 Tape Speed
Choose a long term averaging period (minutes) and a short term averaging period (seconds)
The indicator will begin loading ticks for the duration of the specified longer term averaging period.
ex: If the indicator is set to have a long term average of 10min, you must run the indicator for 10min first for it to begin its averaging process.
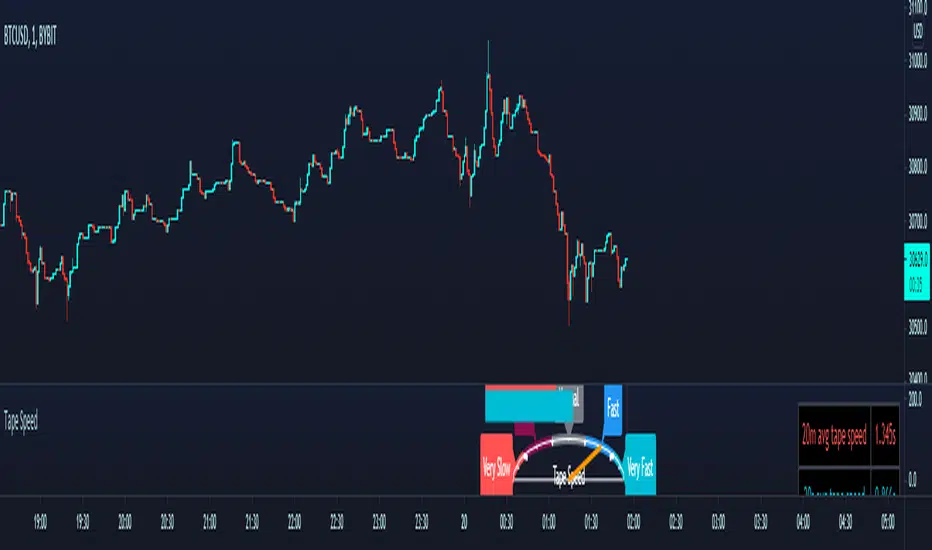
When the required duration of ticks have loaded, it will display the average time elapsed between each tick during that time.
It will also continue to read incoming ticks and calculate new averages once the initial load is finished.
The longer term average is displayed as a static red horizontal bar, the entire speedomter gauge, and the value is also explicitly stated in the top right corner with the table.
The blue bar, the needle, and the bottom row of the table are all representations of the shorter term period's average time between ticks.
The shorter term average is compared against the longer term average to determine whether the short term incoming orders are coming in more aggressively/less aggressively or normally compared to the longer period's average.
___________________________________________________________
Thanks to user rumpypumpydumpy for giving me permission to use his semicircle logic from his "Speedometer Toolbox" to display my own data.

The indicator will begin loading ticks for the duration of the specified longer term averaging period.
ex: If the indicator is set to have a long term average of 10min, you must run the indicator for 10min first for it to begin its averaging process.
When the required duration of ticks have loaded, it will display the average time elapsed between each tick during that time.
It will also continue to read incoming ticks and calculate new averages once the initial load is finished.
The longer term average is displayed as a static red horizontal bar, the entire speedomter gauge, and the value is also explicitly stated in the top right corner with the table.
The blue bar, the needle, and the bottom row of the table are all representations of the shorter term period's average time between ticks.
The shorter term average is compared against the longer term average to determine whether the short term incoming orders are coming in more aggressively/less aggressively or normally compared to the longer period's average.
___________________________________________________________
Thanks to user rumpypumpydumpy for giving me permission to use his semicircle logic from his "Speedometer Toolbox" to display my own data.
릴리즈 노트
.초대 전용 스크립트
이 스크립트는 작성자가 승인한 사용자만 접근할 수 있습니다. 사용하려면 요청 후 승인을 받아야 하며, 일반적으로 결제 후에 허가가 부여됩니다. 자세한 내용은 아래 작성자의 안내를 따르거나 Chonky_에게 직접 문의하세요.
트레이딩뷰는 스크립트의 작동 방식을 충분히 이해하고 작성자를 완전히 신뢰하지 않는 이상, 해당 스크립트에 비용을 지불하거나 사용하는 것을 권장하지 않습니다. 커뮤니티 스크립트에서 무료 오픈소스 대안을 찾아보실 수도 있습니다.
작성자 지시 사항
DM me to beta test if you are familiar with Tape Speed/Pace of Tape from other platforms and use it often. I am looking for suggestions/improvements and need feedback.
면책사항
해당 정보와 게시물은 금융, 투자, 트레이딩 또는 기타 유형의 조언이나 권장 사항으로 간주되지 않으며, 트레이딩뷰에서 제공하거나 보증하는 것이 아닙니다. 자세한 내용은 이용 약관을 참조하세요.
초대 전용 스크립트
이 스크립트는 작성자가 승인한 사용자만 접근할 수 있습니다. 사용하려면 요청 후 승인을 받아야 하며, 일반적으로 결제 후에 허가가 부여됩니다. 자세한 내용은 아래 작성자의 안내를 따르거나 Chonky_에게 직접 문의하세요.
트레이딩뷰는 스크립트의 작동 방식을 충분히 이해하고 작성자를 완전히 신뢰하지 않는 이상, 해당 스크립트에 비용을 지불하거나 사용하는 것을 권장하지 않습니다. 커뮤니티 스크립트에서 무료 오픈소스 대안을 찾아보실 수도 있습니다.
작성자 지시 사항
DM me to beta test if you are familiar with Tape Speed/Pace of Tape from other platforms and use it often. I am looking for suggestions/improvements and need feedback.
면책사항
해당 정보와 게시물은 금융, 투자, 트레이딩 또는 기타 유형의 조언이나 권장 사항으로 간주되지 않으며, 트레이딩뷰에서 제공하거나 보증하는 것이 아닙니다. 자세한 내용은 이용 약관을 참조하세요.