OPEN-SOURCE SCRIPT
Grouped EMAs
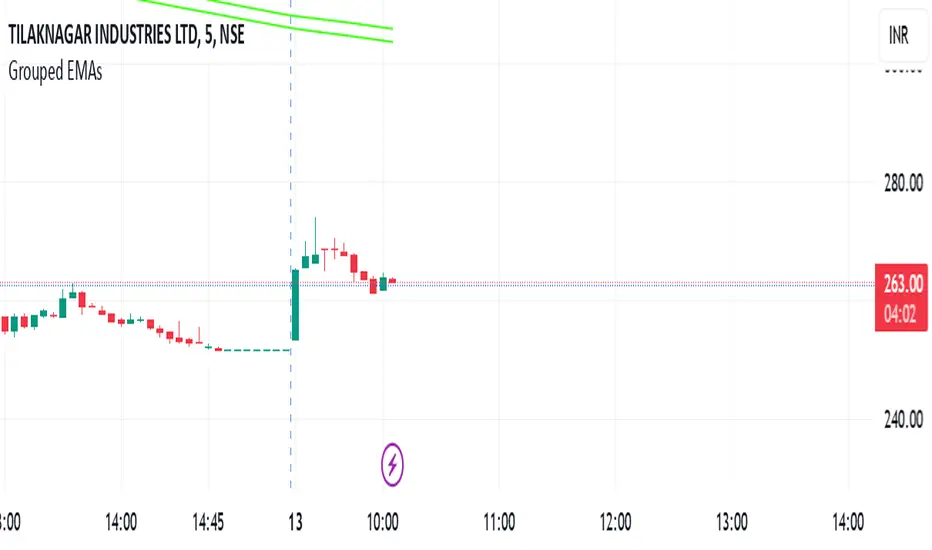
This indicator displays grouped EMAs across multiple timeframes (5m, 15m, 30m, and 60m) on a single chart. It allows traders to easily track key EMA levels across different timeframes for better trend analysis and decision-making.
Key Features:
Adjustable EMA Length: Change the EMA period once, and it updates across all timeframes simultaneously.
Multi-Timeframe Support: Displays 365 EMA High and Low for 5-minute, 15-minute, 30-minute, and 60-minute intervals.
Clear Color Coding: Each timeframe is color-coded for quick visual recognition.
How to Use:
Adjust the EMA length using the input option to set your preferred period.
Observe the EMAs across different timeframes to identify support, resistance, and trend directions.
Combine with other indicators or price action strategies for enhanced trading insights.
This tool is ideal for traders looking to simplify multi-timeframe analysis while maintaining flexibility with the EMA period.
Enjoy more informed trading and enhanced trend analysis with Grouped EMAs!
오픈 소스 스크립트
트레이딩뷰의 진정한 정신에 따라, 이 스크립트의 작성자는 이를 오픈소스로 공개하여 트레이더들이 기능을 검토하고 검증할 수 있도록 했습니다. 작성자에게 찬사를 보냅니다! 이 코드는 무료로 사용할 수 있지만, 코드를 재게시하는 경우 하우스 룰이 적용된다는 점을 기억하세요.
면책사항
해당 정보와 게시물은 금융, 투자, 트레이딩 또는 기타 유형의 조언이나 권장 사항으로 간주되지 않으며, 트레이딩뷰에서 제공하거나 보증하는 것이 아닙니다. 자세한 내용은 이용 약관을 참조하세요.
오픈 소스 스크립트
트레이딩뷰의 진정한 정신에 따라, 이 스크립트의 작성자는 이를 오픈소스로 공개하여 트레이더들이 기능을 검토하고 검증할 수 있도록 했습니다. 작성자에게 찬사를 보냅니다! 이 코드는 무료로 사용할 수 있지만, 코드를 재게시하는 경우 하우스 룰이 적용된다는 점을 기억하세요.
면책사항
해당 정보와 게시물은 금융, 투자, 트레이딩 또는 기타 유형의 조언이나 권장 사항으로 간주되지 않으며, 트레이딩뷰에서 제공하거나 보증하는 것이 아닙니다. 자세한 내용은 이용 약관을 참조하세요.