INVITE-ONLY SCRIPT
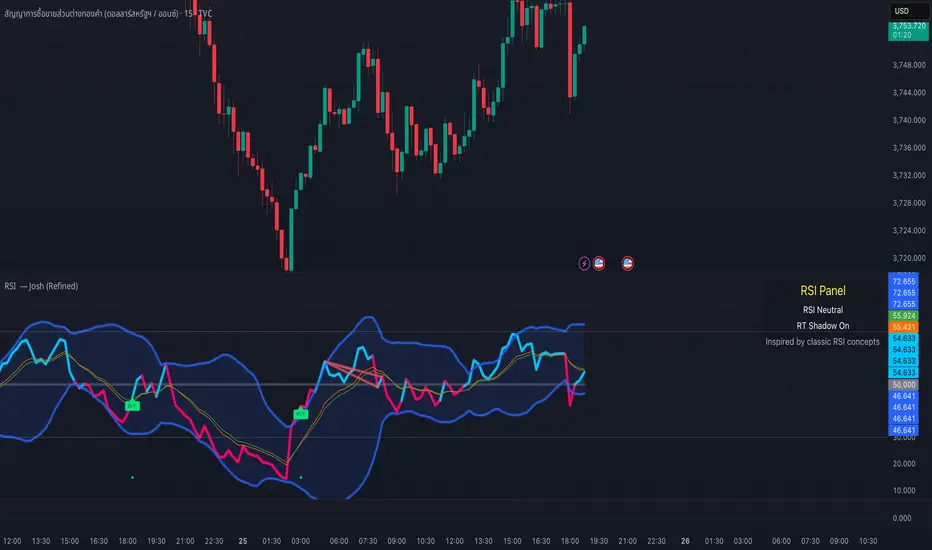
RSI — Josh (Refined)
RSI Buy/Sell Pro — Josh (Refined)
Overview
This study enhances the classic RSI (Relative Strength Index) by adding multiple visualization layers and research tools. It helps users see overbought/oversold conditions, divergence patterns, and momentum shifts more clearly — in a way that is visually intuitive.
⚠️ Disclaimer: This script is for educational and research purposes only. It does not provide financial advice or trading recommendations. Past signals are not indicative of future results. Users remain fully responsible for their own decisions and risk management.
Key Features
Custom RSI Signals
Flexible signal modes (Strict 30/70, Loose, Aggressive 50-cross)
Optional “BUY/SELL” visual text or compact labels
Adjustable cooldown between signals
RSI Divergence Detection
Classic bullish/bearish divergence with pivot confirmation
Real-time “Shadow Divergence” preview (may repaint, by design)
Visual waterline and shaded shadow effects
MA Cross on RSI
Overlay fast/slow moving averages directly on the RSI scale
Crossovers highlighted with markers and alerts
Bollinger Aura (Glow Effect)
Bollinger Bands applied to RSI with customizable color modes
Single color, Upper/Lower, or Zone-driven bull/bear tint
Optional soft fill between bands for clarity
Guidance Panel
On-chart panel summarizing RSI state (OB/OS/Neutral), real-time shadow status, and credits
Alerts Included
RSI BUY / SELL cross conditions
RSI MA cross up / down
Divergence signals (classic & real-time)
Usage Notes
Designed to visualize RSI dynamics and assist in technical research
The “BUY/SELL” markers are visual study tags only — not trade calls
For best practice, combine with higher timeframe context, support/resistance, or volume analysis
Always validate ideas in a demo environment before applying to live trading
Compliance & Credits
Built in Pine Script® v5 on TradingView
Indicator name and labels are for visualization only — not investment advice
Credits: Inspired by classic RSI concepts, refined with additional visualization methods
✅ This description keeps your script compliant:
No performance guarantees
No marketing language like “make profit fast”
Clear disclaimer & educational framing
초대 전용 스크립트
이 스크립트는 작성자가 승인한 사용자만 접근할 수 있습니다. 사용하려면 요청 후 승인을 받아야 하며, 일반적으로 결제 후에 허가가 부여됩니다. 자세한 내용은 아래 작성자의 안내를 따르거나 JOSHSniper4569에게 직접 문의하세요.
트레이딩뷰는 스크립트의 작동 방식을 충분히 이해하고 작성자를 완전히 신뢰하지 않는 이상, 해당 스크립트에 비용을 지불하거나 사용하는 것을 권장하지 않습니다. 커뮤니티 스크립트에서 무료 오픈소스 대안을 찾아보실 수도 있습니다.
작성자 지시 사항
✅ This description keeps your script compliant:
No performance guarantees
No marketing language like “make profit fast”
Clear disclaimer & educational framing
Joshsniper4569
면책사항
해당 정보와 게시물은 금융, 투자, 트레이딩 또는 기타 유형의 조언이나 권장 사항으로 간주되지 않으며, 트레이딩뷰에서 제공하거나 보증하는 것이 아닙니다. 자세한 내용은 이용 약관을 참조하세요.