OPEN-SOURCE SCRIPT
Breakout & Distribution Detector
How the Script Works:
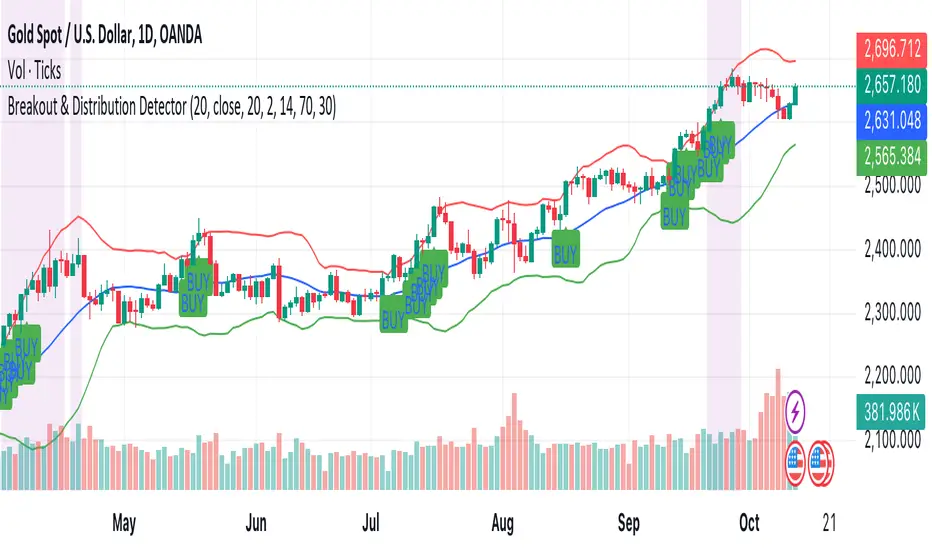
1. Bollinger Bands:
• The upper and lower Bollinger Bands are used to detect volatility and potential breakouts. When the price closes above the upper band, it’s considered a bullish breakout. When the price closes below the lower band, it’s a bearish breakout.
2. RSI (Relative Strength Index):
• The RSI is used for momentum confirmation. A bullish breakout is confirmed if the RSI is above 50, and a bearish breakout is confirmed if the RSI is below 50.
• If the RSI enters overbought (above 70) or oversold (below 30) levels, it signals a distribution phase, indicating the market may be ready to reverse or consolidate.
3. Moving Average:
• A simple moving average (SMA) of 20 periods is used to ensure we’re trading in the direction of the trend. Breakouts above the upper Bollinger Band are valid if the price is above the SMA, while breakouts below the lower Bollinger Band are valid if the price is below the SMA.
4. Signals and Alerts:
• BUY Signal: A green “BUY” label appears below the candle if a bullish breakout is detected.
• SELL Signal: A red “SELL” label appears above the candle if a bearish breakout is detected.
• Distribution Phase: The background turns purple if the market enters a distribution phase (RSI in overbought or oversold territory).
• Alerts: You can set alerts based on these conditions to get notifications for breakouts or when the market enters a distribution phase.
오픈 소스 스크립트
트레이딩뷰의 진정한 정신에 따라, 이 스크립트의 작성자는 이를 오픈소스로 공개하여 트레이더들이 기능을 검토하고 검증할 수 있도록 했습니다. 작성자에게 찬사를 보냅니다! 이 코드는 무료로 사용할 수 있지만, 코드를 재게시하는 경우 하우스 룰이 적용된다는 점을 기억하세요.
면책사항
해당 정보와 게시물은 금융, 투자, 트레이딩 또는 기타 유형의 조언이나 권장 사항으로 간주되지 않으며, 트레이딩뷰에서 제공하거나 보증하는 것이 아닙니다. 자세한 내용은 이용 약관을 참조하세요.
오픈 소스 스크립트
트레이딩뷰의 진정한 정신에 따라, 이 스크립트의 작성자는 이를 오픈소스로 공개하여 트레이더들이 기능을 검토하고 검증할 수 있도록 했습니다. 작성자에게 찬사를 보냅니다! 이 코드는 무료로 사용할 수 있지만, 코드를 재게시하는 경우 하우스 룰이 적용된다는 점을 기억하세요.
면책사항
해당 정보와 게시물은 금융, 투자, 트레이딩 또는 기타 유형의 조언이나 권장 사항으로 간주되지 않으며, 트레이딩뷰에서 제공하거나 보증하는 것이 아닙니다. 자세한 내용은 이용 약관을 참조하세요.