PROTECTED SOURCE SCRIPT
업데이트됨 Order Flow Analysis
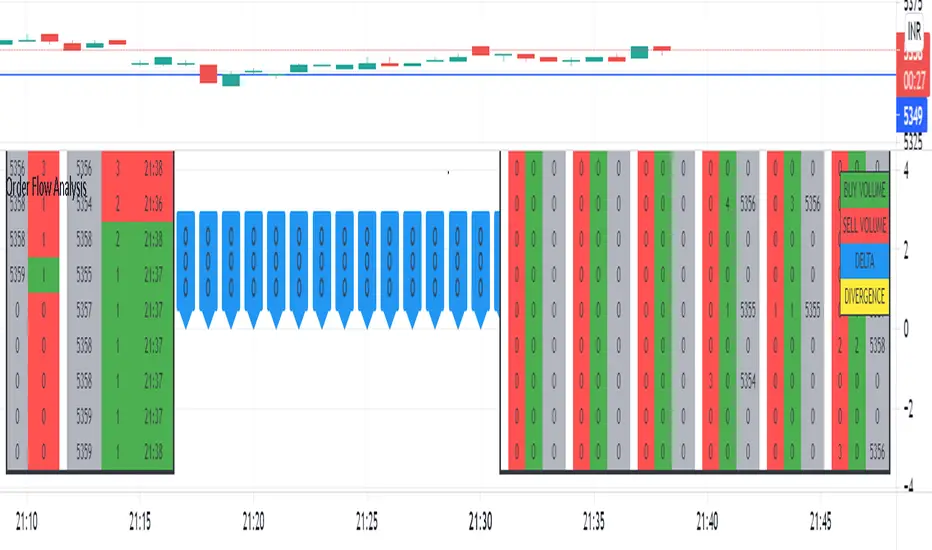
The script plots the order flow clusters for the last six candles in the middle right.
The cluster contains buy volume, sell volume and the price range of the volume.
It calculates uptick volume as buy volume and down tick volume as sell volume and calculates the delta(shown in labels). Recent ATR is considered to determine each cell price range in the cluster.
At the left side, the top volume ticks and the live ticks are displayed.
Please note this works only during market trading hours.
Do not refresh the browser tab and do not change the timeframe, which will cause a reset of numbers.
릴리즈 노트
Delta divergences are shown in labels with yellow color. Labels are present at 0 price.Please scroll and zoom to get the delta labels.Minor enhancements and bug fixes.
릴리즈 노트
Minor enhancements.릴리즈 노트
converted to V5The delta bars now overlay on the chart ( can also be separated into new pane below)
Delta bars size, font size, color and number of required bars can be changed
minor improvements and fixes
Delta labels will be aligned automatically below day's low with an offset that can be changed.
보호된 스크립트입니다
이 스크립트는 비공개 소스로 게시됩니다. 하지만 이를 자유롭게 제한 없이 사용할 수 있습니다 – 자세한 내용은 여기에서 확인하세요.
면책사항
해당 정보와 게시물은 금융, 투자, 트레이딩 또는 기타 유형의 조언이나 권장 사항으로 간주되지 않으며, 트레이딩뷰에서 제공하거나 보증하는 것이 아닙니다. 자세한 내용은 이용 약관을 참조하세요.
보호된 스크립트입니다
이 스크립트는 비공개 소스로 게시됩니다. 하지만 이를 자유롭게 제한 없이 사용할 수 있습니다 – 자세한 내용은 여기에서 확인하세요.
면책사항
해당 정보와 게시물은 금융, 투자, 트레이딩 또는 기타 유형의 조언이나 권장 사항으로 간주되지 않으며, 트레이딩뷰에서 제공하거나 보증하는 것이 아닙니다. 자세한 내용은 이용 약관을 참조하세요.