PROTECTED SOURCE SCRIPT
업데이트됨 Konkorde 2.0
How does Koncorde work?
Well, we already know how we should operate, but how do I know what sharks are doing? Well, here comes the Koncorde indicator.
This indicator is made up of 6 indicators. 4 trend and 2 volume. The 2 volumes are IVP (positive volume index) and IVN (negative volume index). These two indicators are interesting as they are programmed to proportionally attribute the volume traded between strong hands (sharks) and weak hands (minnows).
As for which temporality to use, the bigger the better, since at the end of the day what we are doing is data analysis and therefore the more data, the better. I personally use it in daily candles.
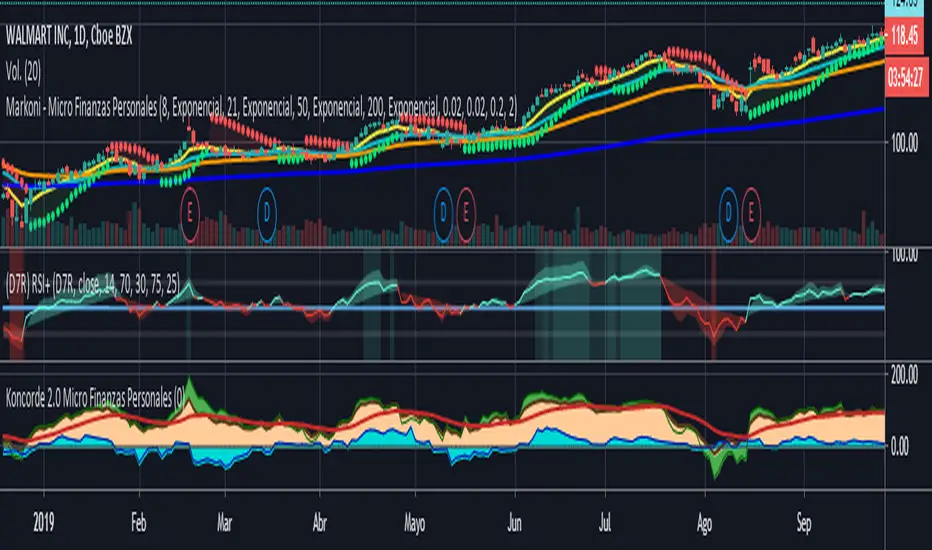
And all this, how is it represented in the indicator? Its graphic representation consists of three overlapping layers and a red line.
Signal (red): Average represented with a red line
Mountain (brown): It is the brown layer that indicates the price trend
Prado (green: It is the green layer that attributes the purchases or sales of weak hands (minnows)
Water (light blue): It is the blue layer that attributes the purchases or sales of strong hands (sharks)
When strong hands are below zero, they are said to be selling, while when they are above zero, they are said to be buying. The same goes for weak hands. Generally if the strong hands are buying or selling, the price is lateralized (for this the Atlas indicator is very useful). The movement of the price is associated with the purchases and sales that the weak hand makes.
------------------------------------------------------------------------------------------------------------------------------------------------------------------------------------
¿Cómo funciona Koncorde?
Bueno, ya sabemos como debemos operar, pero ¿cómo se yo lo que están haciendo los tiburones? Pues aquí entra en juego el indicador Koncorde.
Este indicador se compone a su vez de 6 indicadores. 4 de tendencia y 2 de volumen. Los 2 de volumen son el IVP (índice de volumen positivo) y el IVN (índice de volumen negativo). Estos dos indicadores son los interesantes ya que están programados para atribuir de manera proporcional el volumen negociado entre las manos fuertes (tiburones) y las manos débiles (pececillos).
En cuanto a que temporalidad usar, cuanto más grande mejor, ya que al fin y al cabo lo que estamos haciendo es análisis de datos y por tanto cuantos más datos, mejor. Yo personalmente lo uso en velas diarias.
Y todo esto, ¿cómo se representa en el indicador? Su representación gráfica consta de tres capas solapadas y una linea roja.
Señal (rojo): Media representada con una linea roja
Montaña (marrón): Es la capa marrón que indica la tendencia del precio
Prado (verde: Es la capa verde que atribuye las compras o ventas de las manos débiles (los pececillos)
Agua (celeste): Es la capa azul que atribuye las compras o ventas de las manos fuertes (los tiburones)
Cuando las manos fuertes se sitúan por debajo de cero, se dice que están vendiendo mientras que cuando están por encima de cero, se dice que están comprando. Lo mismo ocurre con las manos débiles. Generalmente si las manos fuertes están comprando o vendiendo, el precio queda lateralizado (para esto vienen muy bien el indicador Atlas). El movimiento del precio se asocia a las compras y ventas que hace la mano débil.
Well, we already know how we should operate, but how do I know what sharks are doing? Well, here comes the Koncorde indicator.
This indicator is made up of 6 indicators. 4 trend and 2 volume. The 2 volumes are IVP (positive volume index) and IVN (negative volume index). These two indicators are interesting as they are programmed to proportionally attribute the volume traded between strong hands (sharks) and weak hands (minnows).
As for which temporality to use, the bigger the better, since at the end of the day what we are doing is data analysis and therefore the more data, the better. I personally use it in daily candles.
And all this, how is it represented in the indicator? Its graphic representation consists of three overlapping layers and a red line.
Signal (red): Average represented with a red line
Mountain (brown): It is the brown layer that indicates the price trend
Prado (green: It is the green layer that attributes the purchases or sales of weak hands (minnows)
Water (light blue): It is the blue layer that attributes the purchases or sales of strong hands (sharks)
When strong hands are below zero, they are said to be selling, while when they are above zero, they are said to be buying. The same goes for weak hands. Generally if the strong hands are buying or selling, the price is lateralized (for this the Atlas indicator is very useful). The movement of the price is associated with the purchases and sales that the weak hand makes.
------------------------------------------------------------------------------------------------------------------------------------------------------------------------------------
¿Cómo funciona Koncorde?
Bueno, ya sabemos como debemos operar, pero ¿cómo se yo lo que están haciendo los tiburones? Pues aquí entra en juego el indicador Koncorde.
Este indicador se compone a su vez de 6 indicadores. 4 de tendencia y 2 de volumen. Los 2 de volumen son el IVP (índice de volumen positivo) y el IVN (índice de volumen negativo). Estos dos indicadores son los interesantes ya que están programados para atribuir de manera proporcional el volumen negociado entre las manos fuertes (tiburones) y las manos débiles (pececillos).
En cuanto a que temporalidad usar, cuanto más grande mejor, ya que al fin y al cabo lo que estamos haciendo es análisis de datos y por tanto cuantos más datos, mejor. Yo personalmente lo uso en velas diarias.
Y todo esto, ¿cómo se representa en el indicador? Su representación gráfica consta de tres capas solapadas y una linea roja.
Señal (rojo): Media representada con una linea roja
Montaña (marrón): Es la capa marrón que indica la tendencia del precio
Prado (verde: Es la capa verde que atribuye las compras o ventas de las manos débiles (los pececillos)
Agua (celeste): Es la capa azul que atribuye las compras o ventas de las manos fuertes (los tiburones)
Cuando las manos fuertes se sitúan por debajo de cero, se dice que están vendiendo mientras que cuando están por encima de cero, se dice que están comprando. Lo mismo ocurre con las manos débiles. Generalmente si las manos fuertes están comprando o vendiendo, el precio queda lateralizado (para esto vienen muy bien el indicador Atlas). El movimiento del precio se asocia a las compras y ventas que hace la mano débil.
릴리즈 노트
Notas de prensa: Changes to this koncorde are discussed. more than anything a solution to the volume parameters of both weights and whales so that the calculation is correct.The calculation uses functions from scrip version 4 so it is more correct with respect to the other surrounding versions.
--------------------------------------------------------------------------------------------------------------------------------------------------------------------------------
Se comenta los cambios de este koncorde. mas que nada una solución a los parámetros de volumen tanto de peses como ballenas para que el calculo sea el correcto.
El calculo usa funciones de la versión 4 de scrip por lo que es mas correcto con respecto a las otras versiones circundantes.
릴리즈 노트
Marca personal del creador보호된 스크립트입니다
이 스크립트는 비공개 소스로 게시됩니다. 하지만 이를 자유롭게 제한 없이 사용할 수 있습니다 – 자세한 내용은 여기에서 확인하세요.
면책사항
해당 정보와 게시물은 금융, 투자, 트레이딩 또는 기타 유형의 조언이나 권장 사항으로 간주되지 않으며, 트레이딩뷰에서 제공하거나 보증하는 것이 아닙니다. 자세한 내용은 이용 약관을 참조하세요.
보호된 스크립트입니다
이 스크립트는 비공개 소스로 게시됩니다. 하지만 이를 자유롭게 제한 없이 사용할 수 있습니다 – 자세한 내용은 여기에서 확인하세요.
면책사항
해당 정보와 게시물은 금융, 투자, 트레이딩 또는 기타 유형의 조언이나 권장 사항으로 간주되지 않으며, 트레이딩뷰에서 제공하거나 보증하는 것이 아닙니다. 자세한 내용은 이용 약관을 참조하세요.