OPEN-SOURCE SCRIPT
Relative Strength with 3 SMA
Mansfield RS with 3 SMAs
Overview
The Mansfield Relative Strength (RS) indicator with three Simple Moving Averages (SMAs) enhances traditional RS analysis by adding more clarity and precision to trend identification. This personalized version aims to define RS trends more clearly and end them sooner, helping traders make better-informed decisions.
Key Features
Relative Strength Calculation:
Comparison: Calculates the RS of a chosen symbol against a benchmark (default: S&P 500).
Normalization: Uses the stock’s closing price divided by the closing price of the benchmark over a specified period.
Three SMAs:
Periods: Configurable periods for three SMAs (default: 10, 20, 50).
Trend Smoothing: SMAs help smooth the RS line, making it easier to spot trends and potential reversals.
Visualization:
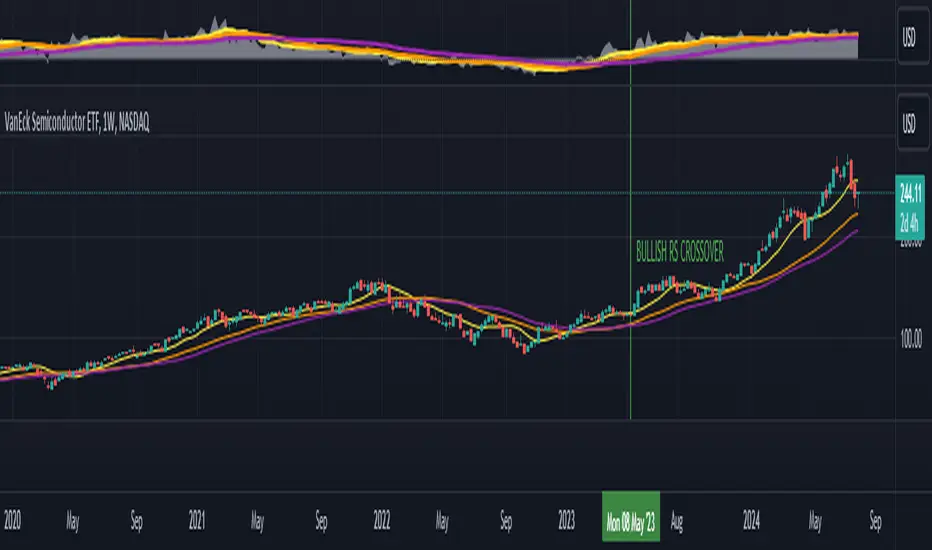
Area Plot: The RS line is displayed as an area plot.
Color Coding: Different colors for each SMA to distinguish them easily (yellow, orange, purple).
Customization Options:
Comparative Symbol: Choose any benchmark symbol.
Period Adjustment: Customize the periods for both the RS calculation and the SMAs.
Visibility: Option to show or hide the SMAs.
How to Use
Setup:
Add to Chart: Apply the indicator to your TradingView chart.
Customize: Adjust the comparative symbol, RS period, and SMA periods as per your preference.
Interpretation:
Rising RS Line: Indicates the stock is outperforming the benchmark.
Falling RS Line: Suggests underperformance.
SMA Crossovers: Watch for the RS line crossing above or below the SMAs to signal potential buy or sell points.
Trend Direction: SMAs help confirm the trend direction. A rising RS line above the SMAs indicates a strong relative performance.
Trading Strategy:
Trend Confirmation: Use SMA crossovers to confirm trends.
Divergence: Identify divergences between the price action and the RS line for potential reversal signals.
Overview
The Mansfield Relative Strength (RS) indicator with three Simple Moving Averages (SMAs) enhances traditional RS analysis by adding more clarity and precision to trend identification. This personalized version aims to define RS trends more clearly and end them sooner, helping traders make better-informed decisions.
Key Features
Relative Strength Calculation:
Comparison: Calculates the RS of a chosen symbol against a benchmark (default: S&P 500).
Normalization: Uses the stock’s closing price divided by the closing price of the benchmark over a specified period.
Three SMAs:
Periods: Configurable periods for three SMAs (default: 10, 20, 50).
Trend Smoothing: SMAs help smooth the RS line, making it easier to spot trends and potential reversals.
Visualization:
Area Plot: The RS line is displayed as an area plot.
Color Coding: Different colors for each SMA to distinguish them easily (yellow, orange, purple).
Customization Options:
Comparative Symbol: Choose any benchmark symbol.
Period Adjustment: Customize the periods for both the RS calculation and the SMAs.
Visibility: Option to show or hide the SMAs.
How to Use
Setup:
Add to Chart: Apply the indicator to your TradingView chart.
Customize: Adjust the comparative symbol, RS period, and SMA periods as per your preference.
Interpretation:
Rising RS Line: Indicates the stock is outperforming the benchmark.
Falling RS Line: Suggests underperformance.
SMA Crossovers: Watch for the RS line crossing above or below the SMAs to signal potential buy or sell points.
Trend Direction: SMAs help confirm the trend direction. A rising RS line above the SMAs indicates a strong relative performance.
Trading Strategy:
Trend Confirmation: Use SMA crossovers to confirm trends.
Divergence: Identify divergences between the price action and the RS line for potential reversal signals.
오픈 소스 스크립트
트레이딩뷰의 진정한 정신에 따라, 이 스크립트의 작성자는 이를 오픈소스로 공개하여 트레이더들이 기능을 검토하고 검증할 수 있도록 했습니다. 작성자에게 찬사를 보냅니다! 이 코드는 무료로 사용할 수 있지만, 코드를 재게시하는 경우 하우스 룰이 적용된다는 점을 기억하세요.
면책사항
해당 정보와 게시물은 금융, 투자, 트레이딩 또는 기타 유형의 조언이나 권장 사항으로 간주되지 않으며, 트레이딩뷰에서 제공하거나 보증하는 것이 아닙니다. 자세한 내용은 이용 약관을 참조하세요.
오픈 소스 스크립트
트레이딩뷰의 진정한 정신에 따라, 이 스크립트의 작성자는 이를 오픈소스로 공개하여 트레이더들이 기능을 검토하고 검증할 수 있도록 했습니다. 작성자에게 찬사를 보냅니다! 이 코드는 무료로 사용할 수 있지만, 코드를 재게시하는 경우 하우스 룰이 적용된다는 점을 기억하세요.
면책사항
해당 정보와 게시물은 금융, 투자, 트레이딩 또는 기타 유형의 조언이나 권장 사항으로 간주되지 않으며, 트레이딩뷰에서 제공하거나 보증하는 것이 아닙니다. 자세한 내용은 이용 약관을 참조하세요.