OPEN-SOURCE SCRIPT
PA-Adaptive Hull Parabolic [Loxx]
The PA-Adaptive Hull Parabolic [Loxx] is not your typical trading indicator. It synthesizes the computational brilliance of two famed technicians: John Ehlers and John Hull. Let's demystify its sophistication.
█ Ehlers' Phase Accumulation
John Ehlers is well-known in the trading community for his digital signal processing approach to market data. One of his standout techniques is phase accumulation. This method identifies the dominant cycle in the market by accumulating the phases of individual cycles. By doing so, it "adapts" to real-time market conditions.
Here's the brilliance of phase accumulation in this code
Hull's Moving Average
John Hull introduced the Hull Moving Average (HMA) aiming to reduce lag and improve smoothing. The HMA's essence lies in its weighted average computation, prioritizing more recent prices.
This code takes an adaptive twist on the HMA
█ Trading Insights
█ Conclusion
The PA-Adaptive Hull Parabolic is a masterclass in advanced technical indicator design. By marrying John Ehlers' adaptive phase accumulation with John Hull's HMA, it creates a dynamic, responsive, and precise tool for traders. It's not just about capturing the trend; it's about understanding the very rhythm of the market.
█ Ehlers' Phase Accumulation
John Ehlers is well-known in the trading community for his digital signal processing approach to market data. One of his standout techniques is phase accumulation. This method identifies the dominant cycle in the market by accumulating the phases of individual cycles. By doing so, it "adapts" to real-time market conditions.
Here's the brilliance of phase accumulation in this code
- The indicator doesn't merely use a static look-back period. Instead, it dynamically determines the dominant market cycle through phase accumulation.
- The calcComp function, rooted in Ehlers' methodology, provides a complex computation using a digital signal processing approach to filter out market noise and pinpoint the current cycle's frequency.
- By measuring and adapting to the instantaneous period of the market, it ensures that the indicator remains relevant, especially in non-stationary market conditions.
Hull's Moving Average
John Hull introduced the Hull Moving Average (HMA) aiming to reduce lag and improve smoothing. The HMA's essence lies in its weighted average computation, prioritizing more recent prices.
This code takes an adaptive twist on the HMA
- Instead of a fixed period, the HMA uses the dominant cycle length derived from Ehlers' phase accumulation. This makes the HMA not just fast and smooth, but also adaptive to the dominant market rhythm.
- The intricate iLwmp function in the script provides this adaptive HMA computation. It's a weighted moving average, but its length isn't static; it's based on the previously determined dominant market cycle.
█ Trading Insights
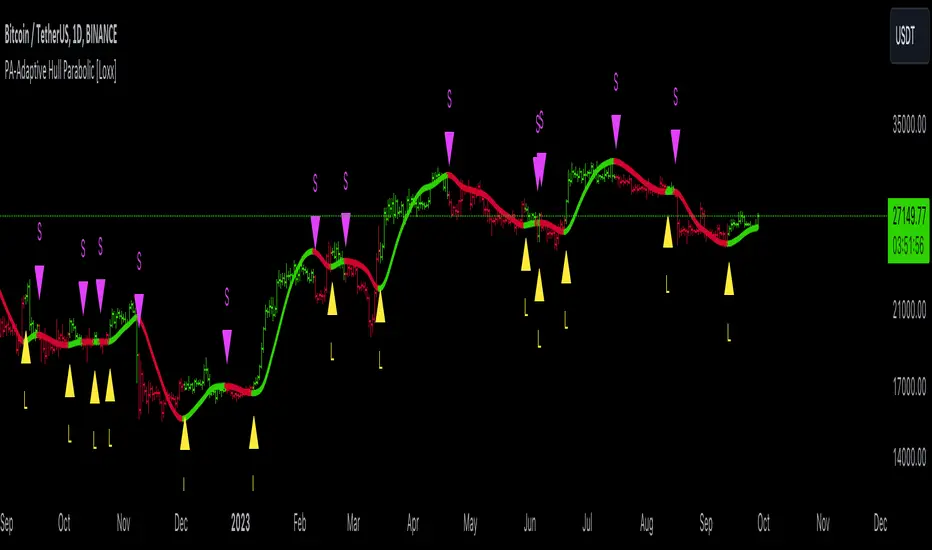
- The indicator paints the bars to represent the immediate trend: green for bullish and red for bearish.
- Entry points, both long ("L") and short ("S"), are presented visually. These are derived from crossovers of the adaptive HMA, a clear indication of a potential shift in the trend.
- Additionally, alert conditions are set, ready to notify a trader when these crossovers occur, ensuring real-time actionable insights.
█ Conclusion
The PA-Adaptive Hull Parabolic is a masterclass in advanced technical indicator design. By marrying John Ehlers' adaptive phase accumulation with John Hull's HMA, it creates a dynamic, responsive, and precise tool for traders. It's not just about capturing the trend; it's about understanding the very rhythm of the market.
오픈 소스 스크립트
트레이딩뷰의 진정한 정신에 따라, 이 스크립트의 작성자는 이를 오픈소스로 공개하여 트레이더들이 기능을 검토하고 검증할 수 있도록 했습니다. 작성자에게 찬사를 보냅니다! 이 코드는 무료로 사용할 수 있지만, 코드를 재게시하는 경우 하우스 룰이 적용된다는 점을 기억하세요.
Public Telegram Group, t.me/algxtrading_public
VIP Membership Info: patreon.com/algxtrading/membership
VIP Membership Info: patreon.com/algxtrading/membership
면책사항
해당 정보와 게시물은 금융, 투자, 트레이딩 또는 기타 유형의 조언이나 권장 사항으로 간주되지 않으며, 트레이딩뷰에서 제공하거나 보증하는 것이 아닙니다. 자세한 내용은 이용 약관을 참조하세요.