ZRO is now sitting at a critical equilibrium point — the market is deciding whether this long accumulation phase will end with a massive bullish reversal or a final breakdown into capitulation.
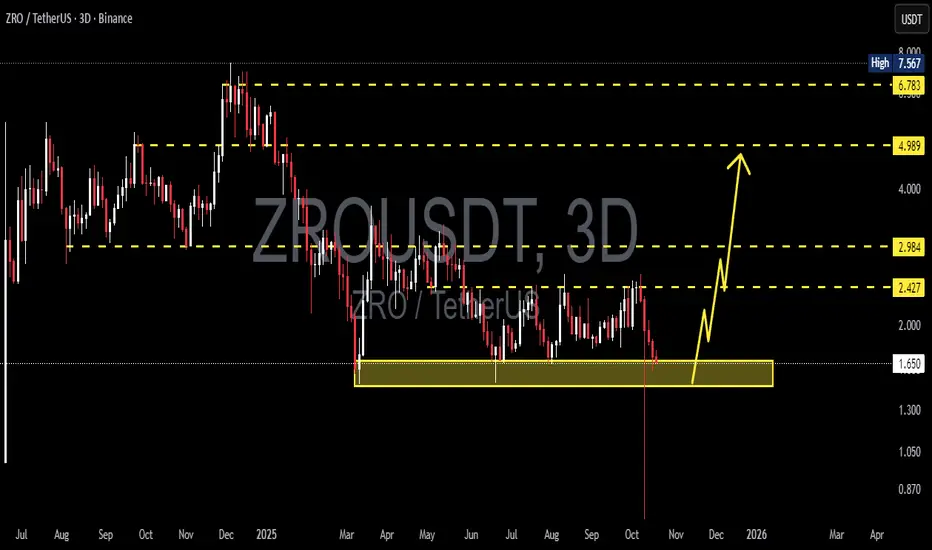
The support zone at 1.465–1.665 (yellow block) has been the final defense that consistently absorbs selling pressure. Each retest of this zone has triggered a strong bounce, indicating that smart money continues to accumulate in this region.
The sharp wick below support earlier in October suggests a liquidity sweep — retail stop-losses were likely taken out while institutional buyers began accumulating. We may be witnessing the final shakeout phase before a potential vertical rally.
---
Technical Structure & Pattern Analysis
1. Macro Trend (3D):
After the distribution phase at December highs, price has entered a descending structure that flattened into a clear accumulation range.
Selling momentum is weakening — candles show shorter bodies with long lower shadows, signaling absorption by buyers.
2. Golden Support Zone (1.465–1.665):
This has been the battle zone between buyers and sellers for over six months.
Multiple rejections confirm its importance; holding this level could trigger a mid-term reversal.
3. Emerging Patterns:
Base Formation / Accumulation Box: sideways price action forming a solid bottom structure.
Liquidity Sweep Pattern: long wick below support with no sustained close beneath — a classic bear trap.
Potential Hidden Bullish Divergence: if RSI or similar indicators form higher lows while price remains flat, it strengthens the bullish case for accumulation.
---
Bullish Scenario (Reversal Setup & Targets)
Bullish Catalysts:
3D candle closes decisively above 1.80–1.90 with strong volume.
Valid breakout from the accumulation range formed since June.
Target Levels:
1. 2.427 – 2.984: first reaction zone, potential minor pullback.
2. 4.989: mid-range equilibrium level.
3. 6.783 – 7.567: major supply zone — potential macro reversal zone if momentum sustains.
Bullish Narrative:
A breakout from this zone could mark the beginning of a major markup phase, where price starts drawing liquidity upward step by step. Typically, such moves follow a spring phase — already indicated by the previous wick below support.
---
Bearish Scenario (Breakdown & Capitulation)
Bearish Catalysts:
3D close below 1.465.
Failed reclaim of the broken support zone.
Downside Targets:
1. 1.00 – 0.90: psychological zone and prior wick low.
2. If selling persists, potential extension to 0.75 – 0.60, representing a full capitulation phase.
Bearish Narrative:
A confirmed breakdown below 1.465 could trigger mass liquidation and panic selling, pushing price into its final capitulation stage. However, such capitulation events often precede major cyclical bottoms and the start of new uptrends.
---
Conclusion & Strategy
ZRO is positioned in a golden zone between massive accumulation and final destruction.
Patient buyers may wait for a confirmed breakout above resistance for mid-term swing positions.
Aggressive traders could look for entries near the lower part of the range with tight stops below 1.465.
Bears only gain full control if price closes firmly below 1.465 on the 3D timeframe.
If this structure follows a Wyckoff Accumulation pattern, ZRO might currently be in Phase D (Spring/Shakeout) — the final step before a potential impulsive rally.
#ZROUSDT #ZRO #CryptoAnalysis #TechnicalAnalysis #SupportResistance #Wyckoff #Accumulation #Breakout #CryptoTrading #SwingTrade #CryptoMarket #ReversalSetup
✅ Get Free Signals! Join Our Telegram Channel Here: t.me/TheCryptoNuclear
✅ Twitter: twitter.com/crypto_nuclear
✅ Join Bybit : partner.bybit.com/b/nuclearvip
✅ Benefits : Lifetime Trading Fee Discount -50%
✅ Twitter: twitter.com/crypto_nuclear
✅ Join Bybit : partner.bybit.com/b/nuclearvip
✅ Benefits : Lifetime Trading Fee Discount -50%
면책사항
이 정보와 게시물은 TradingView에서 제공하거나 보증하는 금융, 투자, 거래 또는 기타 유형의 조언이나 권고 사항을 의미하거나 구성하지 않습니다. 자세한 내용은 이용 약관을 참고하세요.