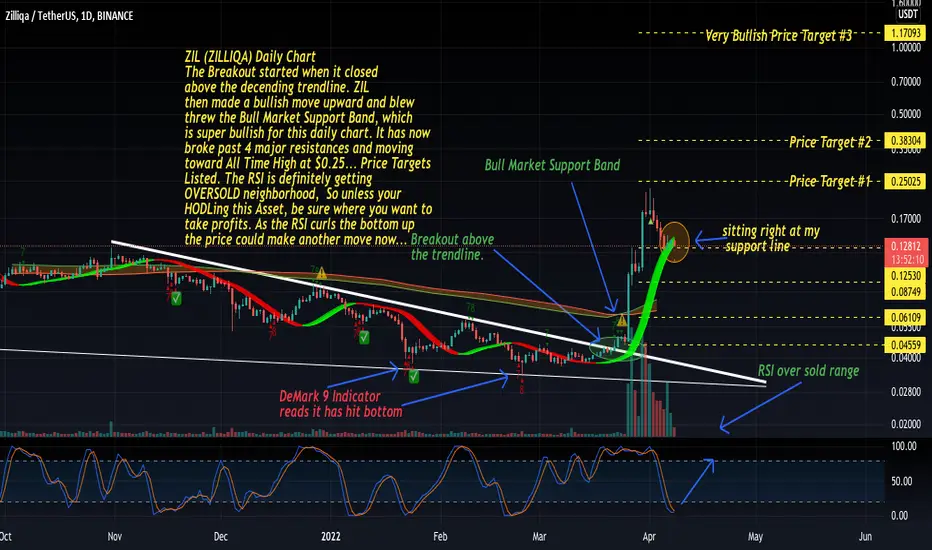
ZIL (ZILLIQA) Daily Chart
The Breakout started when it closed
above the decending trendline. ZIL
then made a bullish move upward and blew
threw the Bull Market Support Band, which
is super bullish for this daily chart. It has now
broke past 4 major resistances and moving
toward All Time High at $0.25... Price Targets
Listed. The RSI is definitely getting
OVERSOLD neighborhood, So unless your
HODLing this Asset, be sure where you want to
take profits. As the RSI curls the bottom up
the price could make another move now...
면책사항
이 정보와 게시물은 TradingView에서 제공하거나 보증하는 금융, 투자, 거래 또는 기타 유형의 조언이나 권고 사항을 의미하거나 구성하지 않습니다. 자세한 내용은 이용 약관을 참고하세요.
면책사항
이 정보와 게시물은 TradingView에서 제공하거나 보증하는 금융, 투자, 거래 또는 기타 유형의 조언이나 권고 사항을 의미하거나 구성하지 않습니다. 자세한 내용은 이용 약관을 참고하세요.