ZECUSDT – Potential Long Setup at Key Fibonacci Level
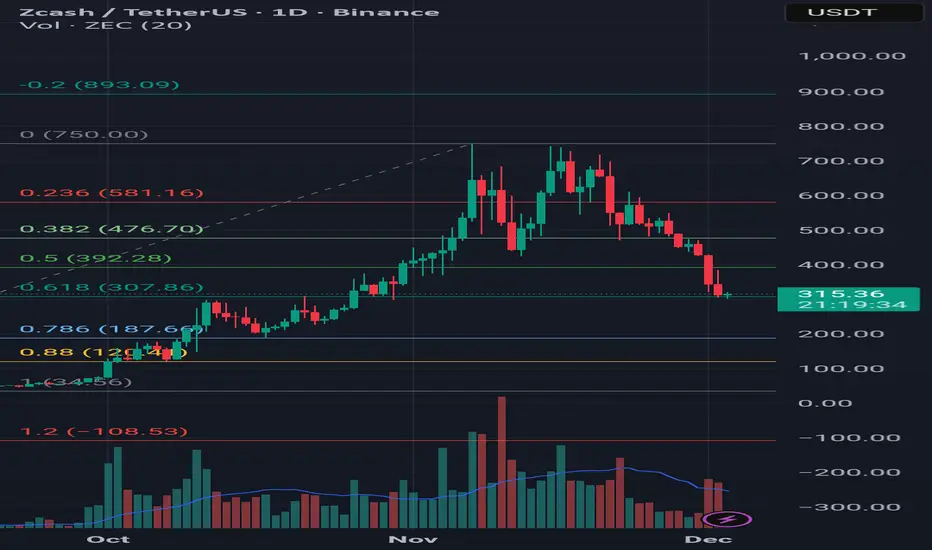
After a strong rally, ZECUSDT has entered a corrective phase, dropping from the 750 zone down to 307.8 – which aligns precisely with the 0.618 Fibonacci retracement level. Historically, this area has acted as a significant resistance twice, and once broken, it led to a notable bullish continuation.
Currently, price action is testing this level again, and given its historical importance, I see potential for a long setup if bullish confirmation appears.
📌 My Targets (TP):
- TP1: 470
- TP2: 658
- TP3: 743
🛡️ Stop Loss: 299
🕒 Timeframe: Daily
📈 Perspective: Long-term
⚠️ Disclaimer: This is not financial advice or a buy/sell signal. Just sharing my personal view based on technical analysis.
면책사항
해당 정보와 게시물은 금융, 투자, 트레이딩 또는 기타 유형의 조언이나 권장 사항으로 간주되지 않으며, 트레이딩뷰에서 제공하거나 보증하는 것이 아닙니다. 자세한 내용은 이용 약관을 참조하세요.
면책사항
해당 정보와 게시물은 금융, 투자, 트레이딩 또는 기타 유형의 조언이나 권장 사항으로 간주되지 않으며, 트레이딩뷰에서 제공하거나 보증하는 것이 아닙니다. 자세한 내용은 이용 약관을 참조하세요.