ZEC’s price rally shows signs of further continuation as momentum and trend indicators align in favor of the bulls.
On the daily chart, the MACD line currently sits above the signal line, reflecting strong buying momentum and suggesting that market participants continue to accumulate rather than distribute. This bullish crossover signals control by buyers and reinforces the upward trend.
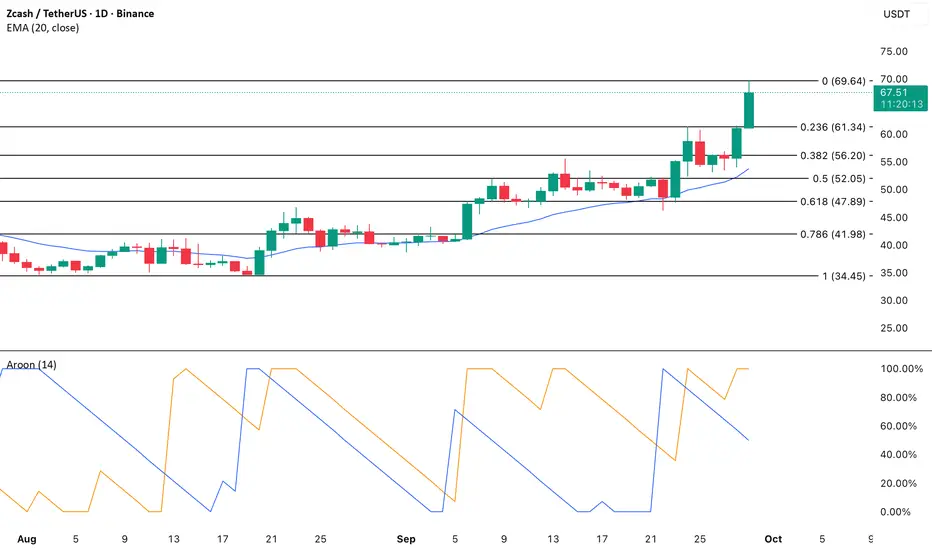
Adding to this view, the Aroon Up Line has surged to 100%, a reading that signals a dominant uptrend. The Aroon indicator tracks how frequently new highs and lows are made, and a strong Up Line reading suggests consistent higher highs and sustained bullish sentiment.
With ZEC trading at levels last seen in December 2024, this momentum reflects renewed investor confidence and opens the door for further gains if bullish conviction holds.
On the daily chart, the MACD line currently sits above the signal line, reflecting strong buying momentum and suggesting that market participants continue to accumulate rather than distribute. This bullish crossover signals control by buyers and reinforces the upward trend.
Adding to this view, the Aroon Up Line has surged to 100%, a reading that signals a dominant uptrend. The Aroon indicator tracks how frequently new highs and lows are made, and a strong Up Line reading suggests consistent higher highs and sustained bullish sentiment.
With ZEC trading at levels last seen in December 2024, this momentum reflects renewed investor confidence and opens the door for further gains if bullish conviction holds.
Leader in crypto news, award winning journalism in 26 languages.
면책사항
해당 정보와 게시물은 금융, 투자, 트레이딩 또는 기타 유형의 조언이나 권장 사항으로 간주되지 않으며, 트레이딩뷰에서 제공하거나 보증하는 것이 아닙니다. 자세한 내용은 이용 약관을 참조하세요.
Leader in crypto news, award winning journalism in 26 languages.
면책사항
해당 정보와 게시물은 금융, 투자, 트레이딩 또는 기타 유형의 조언이나 권장 사항으로 간주되지 않으며, 트레이딩뷰에서 제공하거나 보증하는 것이 아닙니다. 자세한 내용은 이용 약관을 참조하세요.