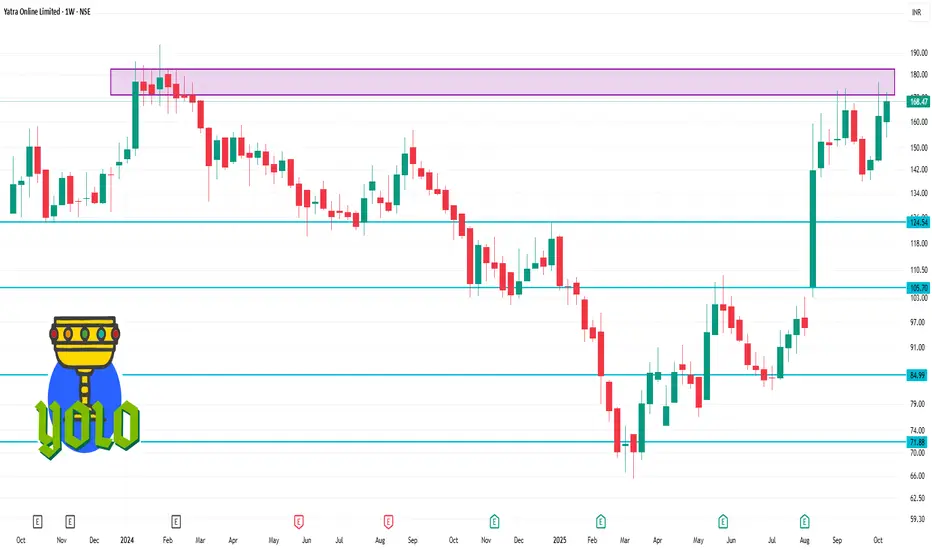
📈 1-Week Price Performance (Oct 10–Oct 17, 2025)
Opening Price (Oct 10): ₹162.23
Closing Price (Oct 17): ₹168.47
Weekly Gain: +3.85%
This upward trend indicates a steady recovery and positive sentiment among investors.
🔍 Key Highlights
52-Week Range: ₹65.51 – ₹176.66
Market Capitalization: ₹2,643.57 crore
P/E Ratio: 53.15
P/B Ratio: 3.29
Earnings Per Share (EPS): ₹3.09 (as of June 2025)
These metrics suggest that while the stock is trading at a premium, it reflects the market's expectations of future growth.
📊 Technical Indicators
50-Day Simple Moving Average (SMA): ₹148.20
200-Day SMA: ₹104.50
Relative Strength Index (RSI): 64.5 (indicating moderate bullish momentum)
Money Flow Index (MFI): 76.1 (approaching overbought territory)
These indicators suggest that the stock is in a strong uptrend, though investors should monitor for potential overbought conditions.
관련 발행물
면책사항
해당 정보와 게시물은 금융, 투자, 트레이딩 또는 기타 유형의 조언이나 권장 사항으로 간주되지 않으며, 트레이딩뷰에서 제공하거나 보증하는 것이 아닙니다. 자세한 내용은 이용 약관을 참조하세요.
관련 발행물
면책사항
해당 정보와 게시물은 금융, 투자, 트레이딩 또는 기타 유형의 조언이나 권장 사항으로 간주되지 않으며, 트레이딩뷰에서 제공하거나 보증하는 것이 아닙니다. 자세한 내용은 이용 약관을 참조하세요.