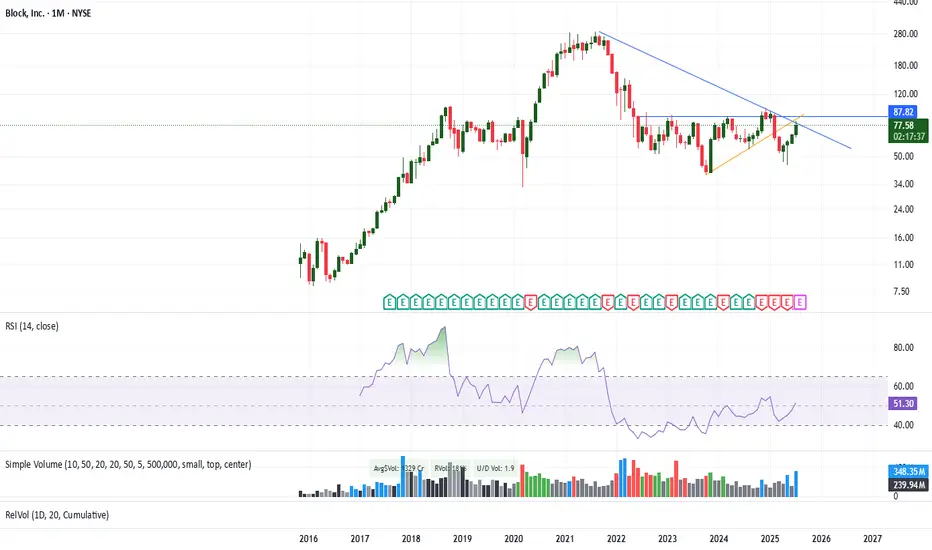
Monthly chart of XYZ shows multiple resistance points (including 200 week) are being tested, however significant volumes on 21st and 22nd July + 10week EMA crossing above 20 Week EMA, along side results day c.6th Aug make this an interesting intersection of resistance lines... am holding since the hammer created around bounce back zone.. will watch it over the next few days before exit.
액티브 트레이드
Closed position 78 (booked 25% gain)The scrip and chart remains of interest, however to rotate funds closed this position for now.
면책사항
이 정보와 게시물은 TradingView에서 제공하거나 보증하는 금융, 투자, 거래 또는 기타 유형의 조언이나 권고 사항을 의미하거나 구성하지 않습니다. 자세한 내용은 이용 약관을 참고하세요.
면책사항
이 정보와 게시물은 TradingView에서 제공하거나 보증하는 금융, 투자, 거래 또는 기타 유형의 조언이나 권고 사항을 의미하거나 구성하지 않습니다. 자세한 내용은 이용 약관을 참고하세요.