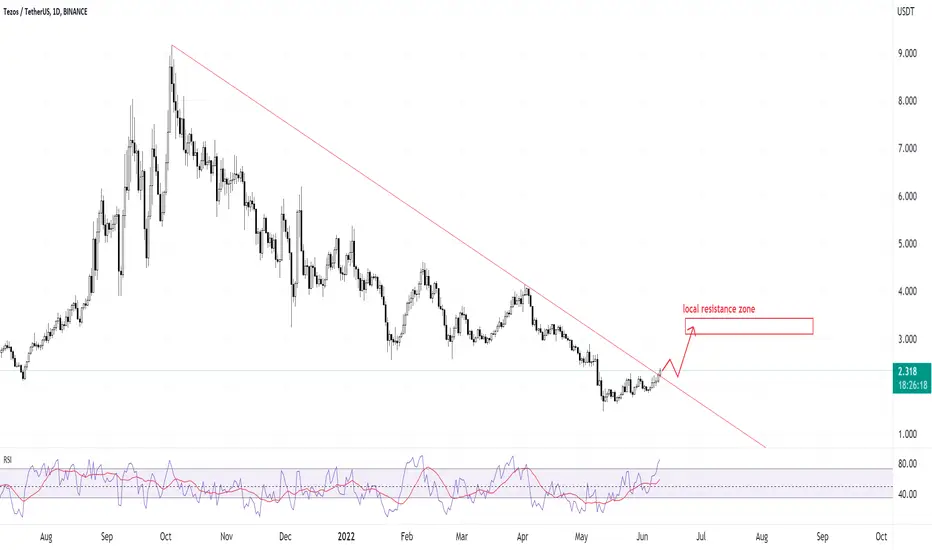
First thing, red resistance line has been broken coming from many months back. Price is indicated to have a good bullish +30% to +40% in the coming month, depending on BTC stability.
In that case, I have marked the local resistance zone.
For a quicker time frame we are actually in a resistance zone right now, and it's very much possible that it will go down towards $2.00 before finally going up. But please keep in mind, overall XTZ is bullish on long term. (4-6 months)
I am linking the shorter time frame (45 min candles) chart below, so you can keep track. With the daily chart above, now you can keep track of important zones.
Good luck!
P.s. I walk the talk, and my trade performance can also be seen on the 45 min chart below. Scroll to the bottom to see my net profit in one year! and my success rate.
노트
As I mentioned in the chart, we are in a resistance zone in the short time frame (45min). I mentioned we will hit $2.00 before going up. Now would be that time.액티브 트레이드
Putting long position관련 발행물
면책사항
이 정보와 게시물은 TradingView에서 제공하거나 보증하는 금융, 투자, 거래 또는 기타 유형의 조언이나 권고 사항을 의미하거나 구성하지 않습니다. 자세한 내용은 이용 약관을 참고하세요.
면책사항
이 정보와 게시물은 TradingView에서 제공하거나 보증하는 금융, 투자, 거래 또는 기타 유형의 조언이나 권고 사항을 의미하거나 구성하지 않습니다. 자세한 내용은 이용 약관을 참고하세요.