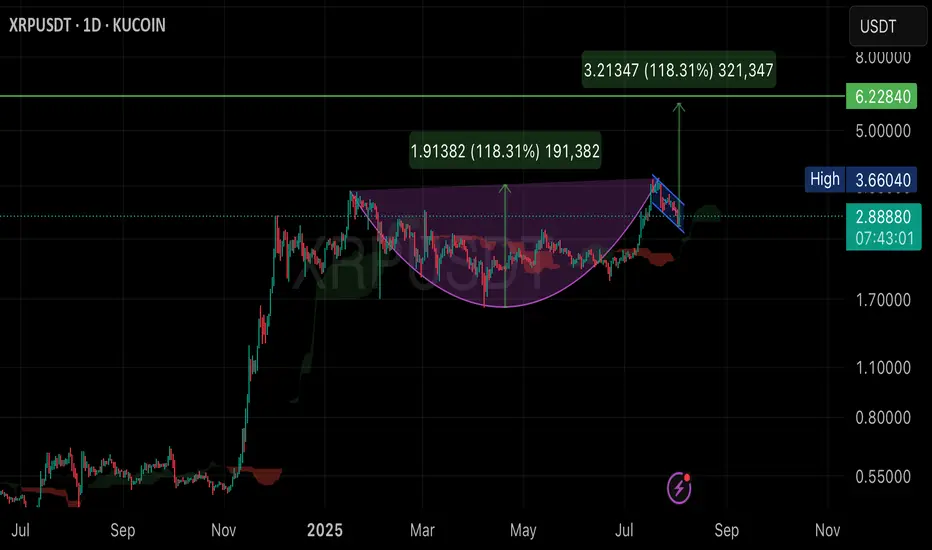
technical analysis chart of the XRP/USDT using daily data (1D). Here are the main details:
• Cup and Handle Pattern: The chart displays a “cup and handle” formation, which is a bullish continuation pattern suggesting further upward movement. The rounded shape below represents the “cup” (running from roughly February to July 2025), and the small channel to the right is the “handle.”
• Target Price:
• The chart shows a projected breakout target from the handle region—from about 2.88 USDT to 6.22 USDT.
• The value 1.91382 (118.31%) is the measured move—calculated from the bottom of the cup to the neckline, then projected upwards from the breakout point.
• Another label, 3.21347 (118.31%), shows a similar projected percent gain (about 118.31%) from the breakout point.
• Support and Resistance Lines:
• Horizontal lines mark key levels, such as 3.66 (recent high) and 6.22 (target).
• Other Indicators:
• The chart uses a red moving average and Ichimoku cloud to highlight trend support and resistance zones.
• Current Status:
• The current price is 2.88881 USDT (up 4.30% on the day).
• A blue channel represents the consolidation phase before an anticipated breakout.
Summary:
This chart suggests that, if there’s a breakout from the “cup and handle” pattern as shown, the next target price for XRP is around 6.22 USDT, representing an estimated 118% gain from the breakout point. The analysis uses technical patterns and indicators to project possible future price movements.
면책사항
이 정보와 게시물은 TradingView에서 제공하거나 보증하는 금융, 투자, 거래 또는 기타 유형의 조언이나 권고 사항을 의미하거나 구성하지 않습니다. 자세한 내용은 이용 약관을 참고하세요.
면책사항
이 정보와 게시물은 TradingView에서 제공하거나 보증하는 금융, 투자, 거래 또는 기타 유형의 조언이나 권고 사항을 의미하거나 구성하지 않습니다. 자세한 내용은 이용 약관을 참고하세요.