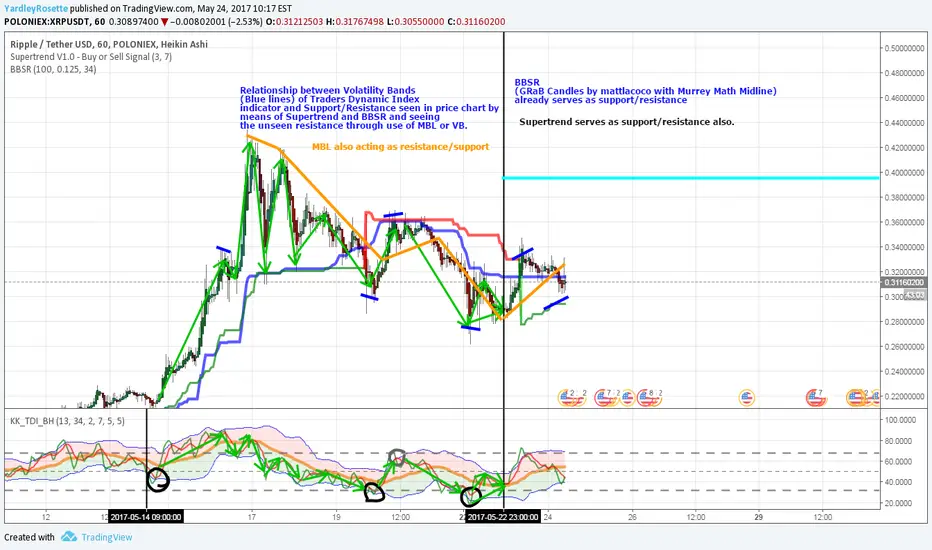
Chart presented shows behavior of lines related to price chart for better use (& understanding) of Traders Dynamic Index for whoever really cares about profiting.
Volatility Bands relate to the price chart showing price resistance or support at the moment.
Market BaseLine may show itself to be support or resistance.
Supertrend & BBSR serve as price chart indication of support or resistance.
RSI/TSI (Green/Red) cross at 32 or 50 while or after, or near crossing into VB lines serves as a powerful/advantageous entry depending also on a bit more of price chart analysis.
노트
This is/was not a trade analysis.면책사항
이 정보와 게시물은 TradingView에서 제공하거나 보증하는 금융, 투자, 거래 또는 기타 유형의 조언이나 권고 사항을 의미하거나 구성하지 않습니다. 자세한 내용은 이용 약관을 참고하세요.
면책사항
이 정보와 게시물은 TradingView에서 제공하거나 보증하는 금융, 투자, 거래 또는 기타 유형의 조언이나 권고 사항을 의미하거나 구성하지 않습니다. 자세한 내용은 이용 약관을 참고하세요.
