Key Observations:
Rising Wedge Breakdown Risk (Bearish Bias)
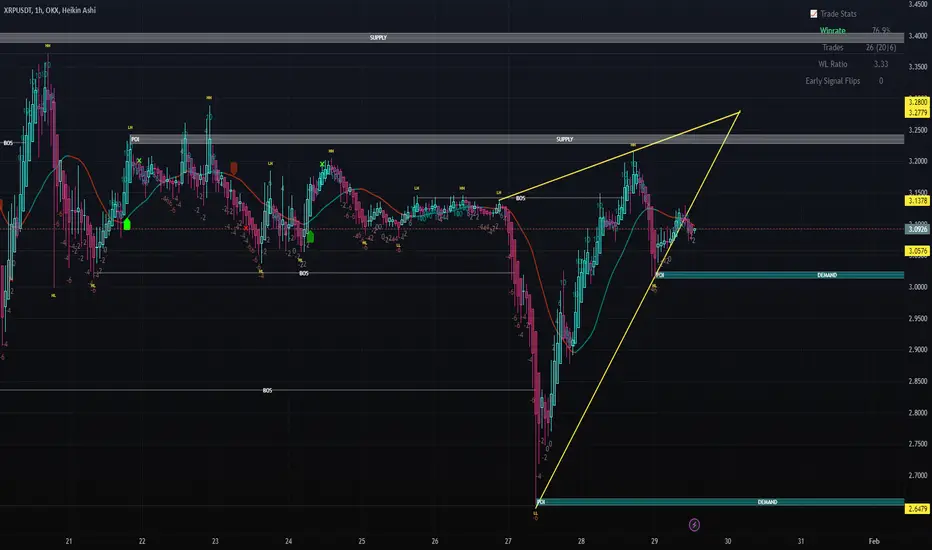
XRP is still within a rising wedge, a bearish pattern that often leads to a breakdown.
Price is testing the lower trendline, indicating a crucial decision point.
Supply & Demand Zones:
Supply Zone (Resistance): 3.28 - 3.13 (Price struggled to break above)
Demand Zone (Support): 3.03 - 2.88 (Price approaching this area)
Lower Demand: 2.65, a strong historical level.
Support & Resistance Levels:
Immediate Resistance: 3.09 - 3.13
Immediate Support: 3.03 - 3.05
Next Major Support: 2.88, aligning with demand.
Break of Structure (BOS) & Price Action:
There is a break of structure (BOS) to the downside, indicating potential trend reversal.
If the wedge breaks down, XRP may move lower.
Potential Next Move (24H Forecast)
Bearish Scenario (Higher Probability, ~70%)
A break below 3.03 could send XRP to 2.88
If bearish momentum continues, 2.65 (lower demand zone) becomes a possible target.
Bullish Scenario (Lower Probability, ~30%)
If XRP holds 3.03, a bounce back to 3.09 - 3.13 is possible.
A break above 3.13 could push toward the 3.28 supply zone.
Final Conclusion:
Bearish Bias – XRP is more likely to break down and test 2.88 soon. If buyers don’t step in, 2.65 is the next key level.
Rising Wedge Breakdown Risk (Bearish Bias)
XRP is still within a rising wedge, a bearish pattern that often leads to a breakdown.
Price is testing the lower trendline, indicating a crucial decision point.
Supply & Demand Zones:
Supply Zone (Resistance): 3.28 - 3.13 (Price struggled to break above)
Demand Zone (Support): 3.03 - 2.88 (Price approaching this area)
Lower Demand: 2.65, a strong historical level.
Support & Resistance Levels:
Immediate Resistance: 3.09 - 3.13
Immediate Support: 3.03 - 3.05
Next Major Support: 2.88, aligning with demand.
Break of Structure (BOS) & Price Action:
There is a break of structure (BOS) to the downside, indicating potential trend reversal.
If the wedge breaks down, XRP may move lower.
Potential Next Move (24H Forecast)
Bearish Scenario (Higher Probability, ~70%)
A break below 3.03 could send XRP to 2.88
If bearish momentum continues, 2.65 (lower demand zone) becomes a possible target.
Bullish Scenario (Lower Probability, ~30%)
If XRP holds 3.03, a bounce back to 3.09 - 3.13 is possible.
A break above 3.13 could push toward the 3.28 supply zone.
Final Conclusion:
Bearish Bias – XRP is more likely to break down and test 2.88 soon. If buyers don’t step in, 2.65 is the next key level.
면책사항
이 정보와 게시물은 TradingView에서 제공하거나 보증하는 금융, 투자, 거래 또는 기타 유형의 조언이나 권고 사항을 의미하거나 구성하지 않습니다. 자세한 내용은 이용 약관을 참고하세요.
면책사항
이 정보와 게시물은 TradingView에서 제공하거나 보증하는 금융, 투자, 거래 또는 기타 유형의 조언이나 권고 사항을 의미하거나 구성하지 않습니다. 자세한 내용은 이용 약관을 참고하세요.