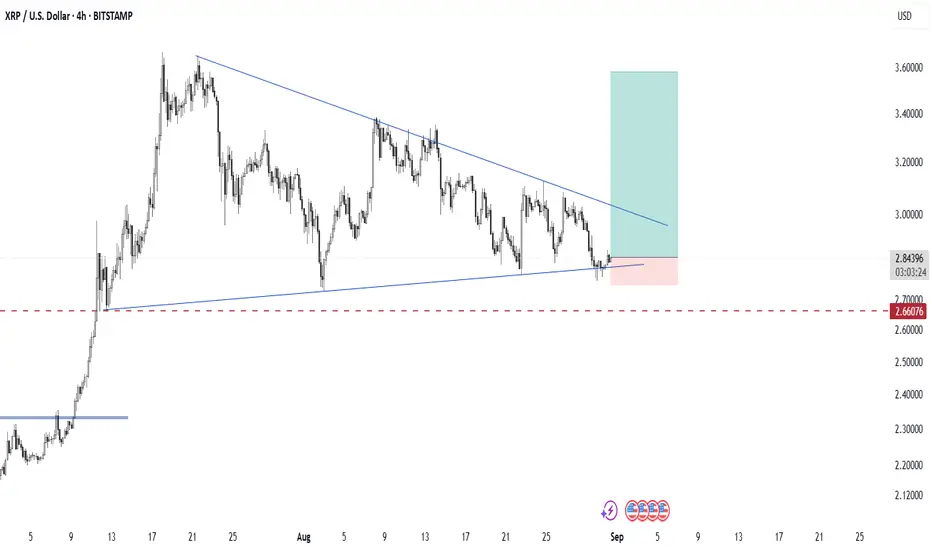
XRP is currently consolidating within a symmetrical triangle pattern, with price action forming lower highs and higher lows. This indicates a period of compression where volatility is decreasing, and a potential breakout could be approaching.
At the moment, the price is testing the lower boundary of the triangle, showing signs of support. As long as XRP holds above the $2.66 support level (highlighted by the dashed red line), the bullish scenario remains valid.
Pattern: Symmetrical Triangle (continuation/neutral pattern)
Entry Zone: Current support trendline near $2.18–$2.20
Stop Loss: Below $2.66 support zone
Target Zone: $3.40 – $3.60 (upper projection of the triangle)
📌 A confirmed breakout above the descending trendline could trigger strong bullish momentum, while a breakdown below $2.66 would invalidate this setup and open the door for deeper correction.
면책사항
해당 정보와 게시물은 금융, 투자, 트레이딩 또는 기타 유형의 조언이나 권장 사항으로 간주되지 않으며, 트레이딩뷰에서 제공하거나 보증하는 것이 아닙니다. 자세한 내용은 이용 약관을 참조하세요.
면책사항
해당 정보와 게시물은 금융, 투자, 트레이딩 또는 기타 유형의 조언이나 권장 사항으로 간주되지 않으며, 트레이딩뷰에서 제공하거나 보증하는 것이 아닙니다. 자세한 내용은 이용 약관을 참조하세요.