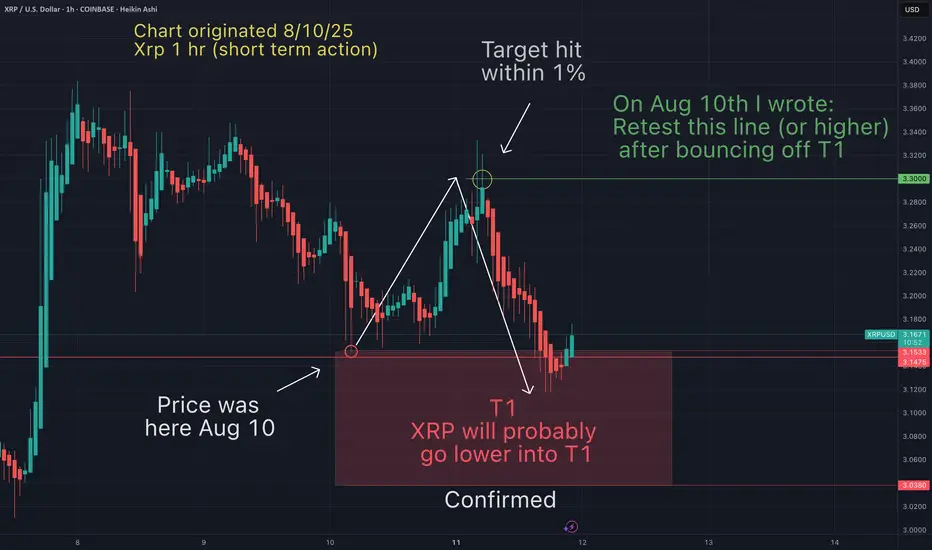
On Aug 10th I suggested the following (see Aug 10th chart below to confirm):
1-My T1 (red box) had been hit, and expecting a bounce (confirmed)
2-Xrp would bounce up to hit $3.3 (confirmed within 1%)
3- After hitting $3.3, "Xrp will probably go lower into T1 (confirmed as of today)
4-Suggested this price action would complete within 1-3 days (confirmed)

Strangely accurate again. These patterns just keep repeating over and over. I can teach you how to identify them (currently accepting 2 new private students).
This chart illustrates that TA works in the short term as well (24hr period)). These principles can applied on ANY timeframe on ANY asset.
Once again I keep stats on my accuracy, and I would do the same for anyone I would follow. How else would I know if they are worth following.
May the trends be with you.
1-My T1 (red box) had been hit, and expecting a bounce (confirmed)
2-Xrp would bounce up to hit $3.3 (confirmed within 1%)
3- After hitting $3.3, "Xrp will probably go lower into T1 (confirmed as of today)
4-Suggested this price action would complete within 1-3 days (confirmed)
Strangely accurate again. These patterns just keep repeating over and over. I can teach you how to identify them (currently accepting 2 new private students).
This chart illustrates that TA works in the short term as well (24hr period)). These principles can applied on ANY timeframe on ANY asset.
Once again I keep stats on my accuracy, and I would do the same for anyone I would follow. How else would I know if they are worth following.
May the trends be with you.
May the trends be with you.
면책사항
해당 정보와 게시물은 금융, 투자, 트레이딩 또는 기타 유형의 조언이나 권장 사항으로 간주되지 않으며, 트레이딩뷰에서 제공하거나 보증하는 것이 아닙니다. 자세한 내용은 이용 약관을 참조하세요.
May the trends be with you.
면책사항
해당 정보와 게시물은 금융, 투자, 트레이딩 또는 기타 유형의 조언이나 권장 사항으로 간주되지 않으며, 트레이딩뷰에서 제공하거나 보증하는 것이 아닙니다. 자세한 내용은 이용 약관을 참조하세요.