- Exxon reversed from resistance area
- Likely to fall to support level 110.00
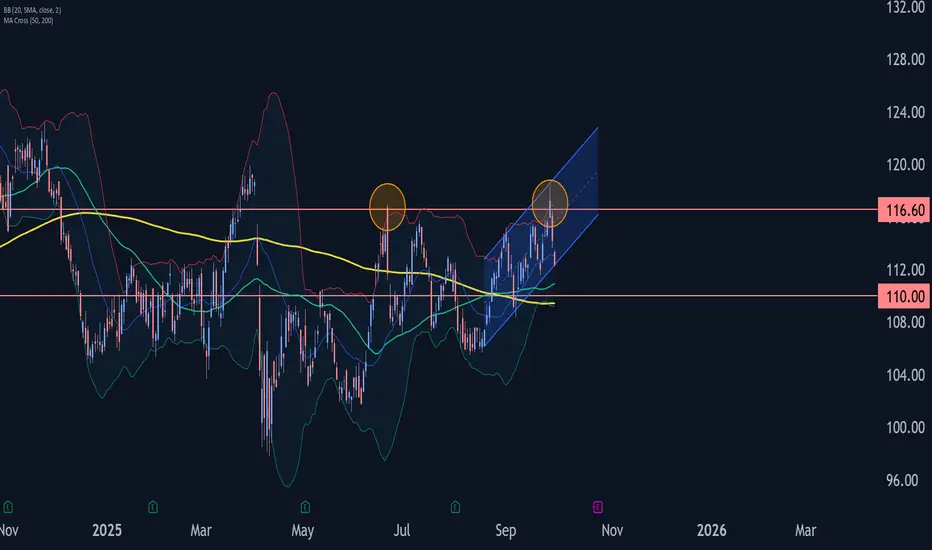
Exxon recently reversed from the resistance area between the strong resistance level 116.60 (former monthly high from June), upper daily Bollinger Band and the resistance trendline of the daily up channel from August.
The downward reversal from this resistance area stopped the (C)-wave of the previous long-term ABC correction 2 from April.
Given the strength of the resistance level 116.60, Exxon can be expected to fall to the next support level 110.00.
- Likely to fall to support level 110.00
Exxon recently reversed from the resistance area between the strong resistance level 116.60 (former monthly high from June), upper daily Bollinger Band and the resistance trendline of the daily up channel from August.
The downward reversal from this resistance area stopped the (C)-wave of the previous long-term ABC correction 2 from April.
Given the strength of the resistance level 116.60, Exxon can be expected to fall to the next support level 110.00.
By the FxPro Analyst Team
Follow our dedicated Telegram channel t.me/fxpro for insightful market analysis and expert commentary.
Reach out to media.comments@fxpro.com for PR and media inquiries
Follow our dedicated Telegram channel t.me/fxpro for insightful market analysis and expert commentary.
Reach out to media.comments@fxpro.com for PR and media inquiries
면책사항
해당 정보와 게시물은 금융, 투자, 트레이딩 또는 기타 유형의 조언이나 권장 사항으로 간주되지 않으며, 트레이딩뷰에서 제공하거나 보증하는 것이 아닙니다. 자세한 내용은 이용 약관을 참조하세요.