
To find the bottom for xmr its best to switch back to higher timeframes. 3day has been working best for me but weekly is also fine.
As correction of the impulse wave there is a possible parallel channel down (from 3day chart).
1.618 Level was the first support which was broken and ended in another sell-off.
Current support was found at the old all time high bottom here is not confirmed.
On channel breakout out up expect major resistance at 0.0156
Horizontal support is likely to be found at the fib levels from old all time high to all time low. Most important horizontal levels are 0.01 and 0.00438. Also watching the green trendlines from old trends.
Being patient with new long entry til bottom is confirmed or heavy oversold on high timeframes.
노트
I dont trust this little pump yet I dont see a great risk reward for longs here but watching closely노트
xmr looks really interesting again, watching closely노트
Those who longed the breakout made a really good trade. Unfortunately i missed that trade.I am not really sure how this plays out, but it looks like there could be a little correction over the next days which could allow another long entry.
액티브 트레이드
consolidation above 0.01 is bullish, enter long노트
out while btc pumping액티브 트레이드
see 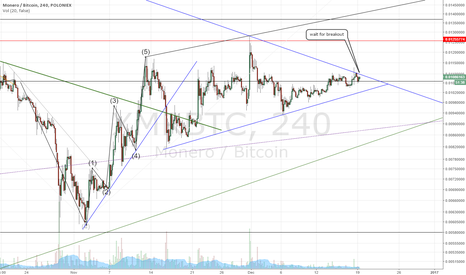
노트
after taking profit in the 0.014-15 its now time to look back on the weekly chart because this seems to break down and target lower support near 0.004. this is invalidated on breakout of the teal trendline. good to be on sideline here again.
노트
too lazy to make a new idea yet, also the fib levels from the alltime chart are still working :) took back a small position in xmr.keeping an eye on the ma50 on the daily chart
관련 발행물
면책사항
해당 정보와 게시물은 금융, 투자, 트레이딩 또는 기타 유형의 조언이나 권장 사항으로 간주되지 않으며, 트레이딩뷰에서 제공하거나 보증하는 것이 아닙니다. 자세한 내용은 이용 약관을 참조하세요.
면책사항
해당 정보와 게시물은 금융, 투자, 트레이딩 또는 기타 유형의 조언이나 권장 사항으로 간주되지 않으며, 트레이딩뷰에서 제공하거나 보증하는 것이 아닙니다. 자세한 내용은 이용 약관을 참조하세요.