📊  XLM Weekly Market Update – Long Setup
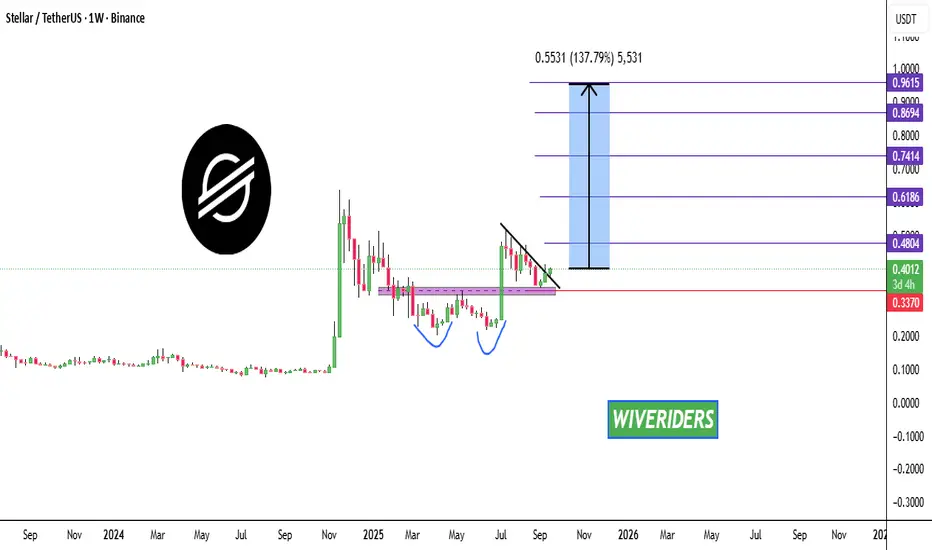
As we can see on the weekly chart,XLM has formed a bullish double bottom pattern ✅
👉 After the pullback, it broke out of the black resistance zone, confirming a bullish structure.
🔼 Trade Idea:
📈 Entry Price (Current): 0.4002
🎯 Targets:
Target 1 → 0.4804
Target 2 → 0.6186
Target 3 → 0.7414
Target 4 → 0.8694
Target 5 → 0.9615
🛑 Stop Loss: 0.3370
⚠️ Risk: ~15.80%
💰 Potential Reward: ~140.19%
📊 Risk/Reward Ratio: ~8.87
📌 Trade Type: Long
👉 If you’re holdingXLM, these are the weekly targets & stop-loss to watch.
As we can see on the weekly chart,
👉 After the pullback, it broke out of the black resistance zone, confirming a bullish structure.
🔼 Trade Idea:
📈 Entry Price (Current): 0.4002
🎯 Targets:
Target 1 → 0.4804
Target 2 → 0.6186
Target 3 → 0.7414
Target 4 → 0.8694
Target 5 → 0.9615
🛑 Stop Loss: 0.3370
⚠️ Risk: ~15.80%
💰 Potential Reward: ~140.19%
📊 Risk/Reward Ratio: ~8.87
📌 Trade Type: Long
👉 If you’re holding
면책사항
이 정보와 게시물은 TradingView에서 제공하거나 보증하는 금융, 투자, 거래 또는 기타 유형의 조언이나 권고 사항을 의미하거나 구성하지 않습니다. 자세한 내용은 이용 약관을 참고하세요.
면책사항
이 정보와 게시물은 TradingView에서 제공하거나 보증하는 금융, 투자, 거래 또는 기타 유형의 조언이나 권고 사항을 의미하거나 구성하지 않습니다. 자세한 내용은 이용 약관을 참고하세요.