XLM/USDT — Daily Chart Analysis
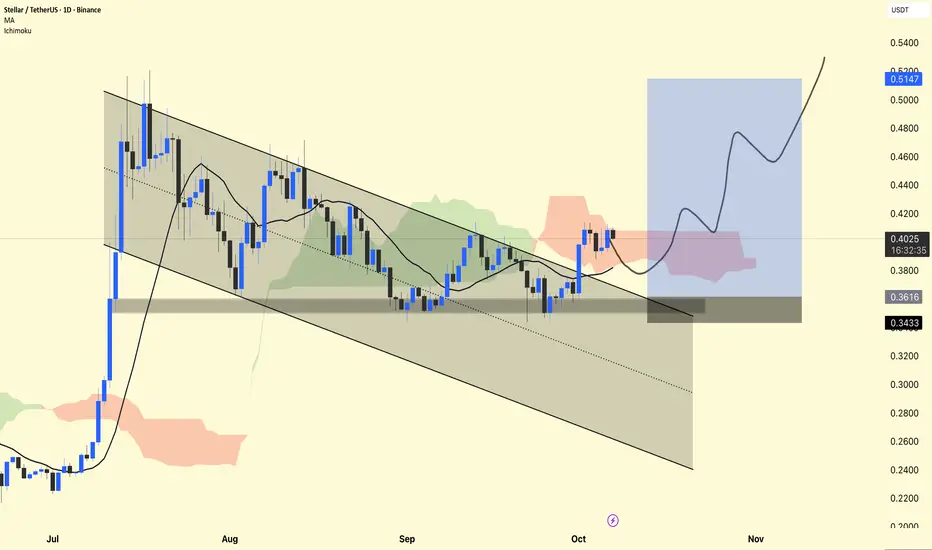
The price is currently trading around $0.40, holding firmly above the demand zone ($0.36–$0.34).
The chart shows a falling channel breakout, which is a bullish reversal pattern.
The Ichimoku Cloud is showing early signs of a bullish trend as the price is attempting to hold above the cloud base.
The moving average (MA) at $0.38 is acting as dynamic support – a positive sign for further upside.
📈 Long Setup:
Entry Zone: $0.38–$0.40
Stop-Loss: Below $0.34 (clear invalidation level)
Targets:
🎯 $0.46 → First Target
🎯 $0.51 → Main Swing Target
DYOR | NFA
관련 발행물
면책사항
해당 정보와 게시물은 금융, 투자, 트레이딩 또는 기타 유형의 조언이나 권장 사항으로 간주되지 않으며, 트레이딩뷰에서 제공하거나 보증하는 것이 아닙니다. 자세한 내용은 이용 약관을 참조하세요.
관련 발행물
면책사항
해당 정보와 게시물은 금융, 투자, 트레이딩 또는 기타 유형의 조언이나 권장 사항으로 간주되지 않으며, 트레이딩뷰에서 제공하거나 보증하는 것이 아닙니다. 자세한 내용은 이용 약관을 참조하세요.