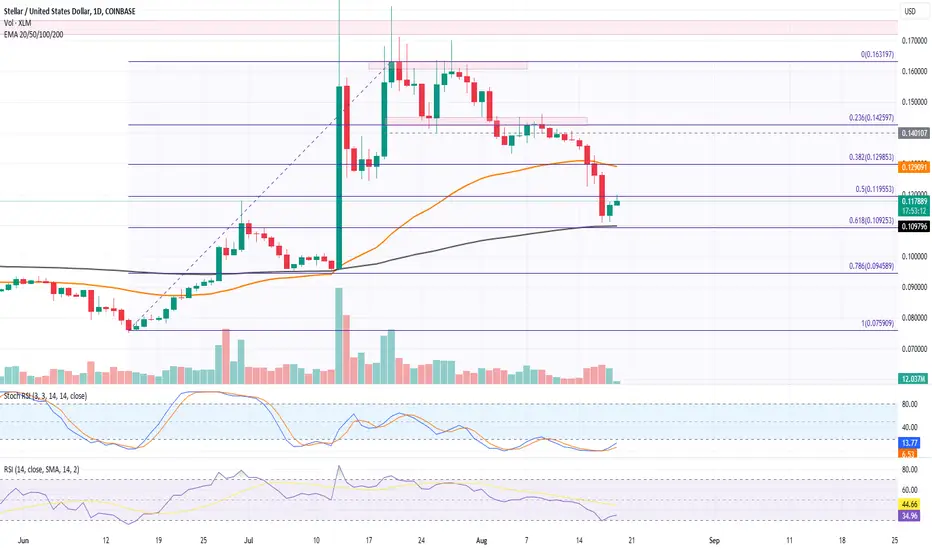
- XLM Price Reversal: The price reversed from the $0.14 resistance zone, resulting in a 20% drop to the 200-day EMA.
- Short Recovery Phase: After reaching the 200-day EMA, a short recovery phase of 4.71% occurred.
- Potential Crash: A breakdown below the 200-day EMA could crash the XLM price to $0.094.
- Sharp Correction: The retest of the $0.14 resistance level led to a sharp correction and a significant discount in Stellar coin price.
- Catalyzed Fall: The intense fall was accelerated by the retest phase and overall market correction.
- Breach of Support Levels: XLM price breached multiple support levels, including the 50-day EMA and 50% Fibonacci level.
- Short-Term Recovery: Absorbing the selling pressure, XLM set for a short-term recovery, extending to 4.12% in the last 48 hours.
- No-Trade Zone: The current recovery remains uncertain, and a breakout of specific Fibonacci levels will signal the next entry.
- Downtrend Continuation Risk: There are strong chances of a downtrend continuation with a potential bullish trap unless the recovery undermines the 10.42% drop bearish candle.
- Uptrend Possibility: If the uptrend breaks above the 50-day EMA, XLM prices may rechallenge for dominance at $0.142.
- Psychological Mark at Risk: A downfall below the 200-day EMA could endanger the $0.10 psychological mark, possibly reaching $0.094.
면책사항
이 정보와 게시물은 TradingView에서 제공하거나 보증하는 금융, 투자, 거래 또는 기타 유형의 조언이나 권고 사항을 의미하거나 구성하지 않습니다. 자세한 내용은 이용 약관을 참고하세요.
면책사항
이 정보와 게시물은 TradingView에서 제공하거나 보증하는 금융, 투자, 거래 또는 기타 유형의 조언이나 권고 사항을 의미하거나 구성하지 않습니다. 자세한 내용은 이용 약관을 참고하세요.