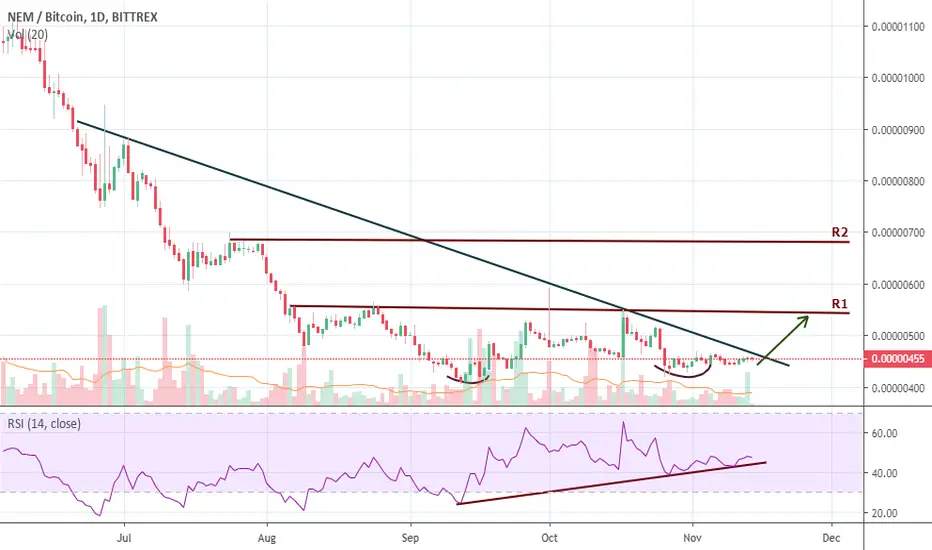
Based on the chart, NEM probably bottomed at 410-420 sats. It perfectly held the previous low when the price retest the support/previous low at 410-420 sats.
In addition, RSI shows a strong sign that it is now in an upward trend.
Now, if the price breaks the trendline it will test the 1st resistance line at 550 sats.
Just remember don't forget to set up a stop-loss because most of the ALTCOINS follow the BITCOIN movement.
Hit Like and Follow me for more updates!
Happy Trading!
Please do your charting and research.
면책사항
이 정보와 게시물은 TradingView에서 제공하거나 보증하는 금융, 투자, 거래 또는 기타 유형의 조언이나 권고 사항을 의미하거나 구성하지 않습니다. 자세한 내용은 이용 약관을 참고하세요.
면책사항
이 정보와 게시물은 TradingView에서 제공하거나 보증하는 금융, 투자, 거래 또는 기타 유형의 조언이나 권고 사항을 의미하거나 구성하지 않습니다. 자세한 내용은 이용 약관을 참고하세요.