Hi ladies.
If you are using tons of tools to identify supply/support and demand/resistances zones. STOP.
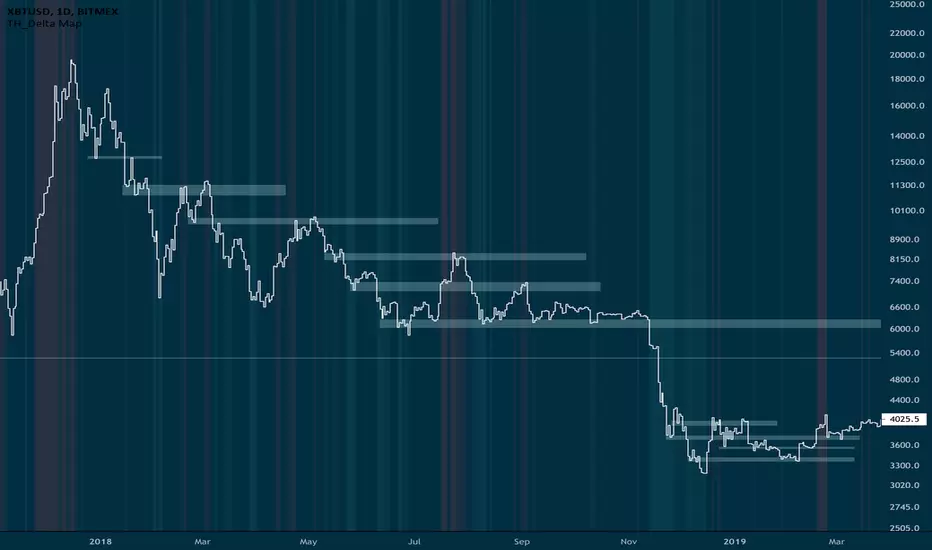
All you need is to apply this simple approach using past price action.
Switch to line chart on M, W and Daily timeframes and identify the Lower closes where price bounces. Map the zone to the left et voila.
All these zones are likely to represent important resistance zones in the future once price goes under them again. We can also look into zones with higher volume signatures which give higher significance to these resistances as well as consolidated sideway at those lows.
Best.
TH
If you are using tons of tools to identify supply/support and demand/resistances zones. STOP.
All you need is to apply this simple approach using past price action.
Switch to line chart on M, W and Daily timeframes and identify the Lower closes where price bounces. Map the zone to the left et voila.
All these zones are likely to represent important resistance zones in the future once price goes under them again. We can also look into zones with higher volume signatures which give higher significance to these resistances as well as consolidated sideway at those lows.
Best.
TH
D7R
면책사항
해당 정보와 게시물은 금융, 투자, 트레이딩 또는 기타 유형의 조언이나 권장 사항으로 간주되지 않으며, 트레이딩뷰에서 제공하거나 보증하는 것이 아닙니다. 자세한 내용은 이용 약관을 참조하세요.
D7R
면책사항
해당 정보와 게시물은 금융, 투자, 트레이딩 또는 기타 유형의 조언이나 권장 사항으로 간주되지 않으며, 트레이딩뷰에서 제공하거나 보증하는 것이 아닙니다. 자세한 내용은 이용 약관을 참조하세요.